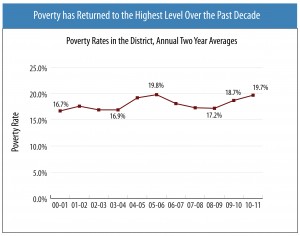
One-in-five DC residents’approximately 123,000–live in poverty, according to U.S. Census Bureau data released today. The Census also found that poverty has grown notably in DC in recent years, as median income for the District has remained relatively flat. The rise in poverty partly reflects the fact that unemployment in the city continued to rise after the official end of the recession and continues to remain high for some groups of residents. The poverty line is $17,900 for a family of three and $23,000 for a family of four. 
The new findings are based on Census data that is best used to describe income and poverty changes at the national level. More detailed and reliable data for DC and the states will be released by the Census Bureau next Thursday, Sept. 20.
Today’s Census Bureau data also show that the number of DC residents lacking health insurance ‘ about 12 percent of residents under age 65 ‘ has not changed and remains one of the lower rates in the nation, especially among children. However, the share of residents getting health insurance from an employer has fallen significantly, which could be due both to falling employment and a reduction in the number of employers providing it. However, this decline has been offset, by a substantial increase in Medicaid coverage’government-sponsored healthcare that is jointly paid for with state and federal dollars.
The District’s 19.7 percent poverty rate for 2010-2011 returns the city to its highest level over the past decade, a 2.5 percentage point increase over 2008-2009[1]. This means 19,000 more DC residents came below the federal poverty line in these two years. After falling in the mid-2000s, DC’s poverty rate has been on the rise for the last several years and has almost returned to the high point of the last decade in 2005-06 (See Figure).
The jump in poverty largely reflects unemployment that remains stubbornly high for some groups of DC residents. Unemployment among District residents with a high school diploma reached 25 percent at the end of 2011, compared with a 10 percent rate in 2007. Similarly, unemployment among Black residents is twice as high today than before the recession started, while the unemployment rate for whites has nearly returned to pre-recession levels.
Median household income in the District was $57,000 in 2010-2011, compared with $54,600 in 2005-2006 before the recession. However, this increase was not statistically significant.
The new Census data show that approximately 63,000 non-elderly DC residents have no health insurance, a number that has remained the same since 2008-2009 but is significantly lower than in 2000-2001. The District’s uninsured rate of 11.8 percent is the 8th lowest rate among states, and it is well below the national uninsured rate of 18.2 percent. Notably, just 4.8 percent of DC’s children are uninsured, which is just half the rate in the country as a whole.
One other notable statistic is that while overall health insurance coverage has remained stable in recent years and improved since 2000, the share of DC residents with employer-sponsored insurance has fallen dramatically. Since 2008-2009, the percent of non-elderly DC residents receiving insurance from their employer fell from 60 percent to 56.6 percent. The proportion of DC children participating in an employer-provided insurance fell from 54 percent to 44 percent over the decade. This could reflect a drop in the number of employed residents, but also a decline in the share of employers providing coverage.
Significant growth in Medicaid over the past decade helped to stabilize coverage. Medicaid covered 49 percent of children in the District in 2010-2011, an increase from 38 percent since the beginning of the decade. Medicaid coverage for non-elderly DC residents was 25.1 percent, an increase from 22 percent since pre-recession 2006-2007.
The Census will release data from the American Community Survey (ACS) on September 20. The ACS has a larger sample size for the 50 states and the District, which will provide a more detailed and accurate look at poverty and income trends, including changes in poverty and income by race and ethnicity, educational attainment, geographic area, and age.
[1] The DC data are averaged together over 2009 and 2010 because the Census Bureau recommends that CPS state-level data be averaged across two-year periods to compensate for the survey’s small sample sizes at the state level.
