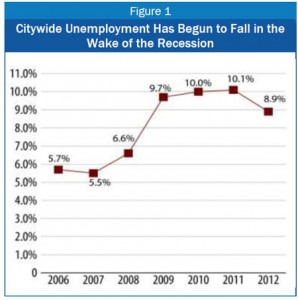
Despite an overall drop in citywide unemployment from 10.1 percent in 2011 to 8.9 percent in 2012, several groups of DC residents continue to face very high rates of joblessness. In particular, the unemployment rate among single parents with children rose in 2012 to nearly 24 percent, twice the 2006 unemployment rate for this group. In addition, the 2012 unemployment rates for low-wage workers, those without a college degree, and African-American workers remained far higher than before the onset of the recession.
 Unemployment rates improved in 2012 for residents with post-secondary degrees, those in high-wage occupations, and White, non-Hispanic residents, falling to rates that were close to pre-recession levels. Unemployment also has fallen sharply in recent years for young workers.
The DC Fiscal Policy Institute is tracking D.C.’s unemployment rate on an annual basis. This analysis uses data from the Census Bureau’s Current Population Survey as well as the Bureau of Labor Statistics to examine unemployment in DC by education level, race/ethnicity, age, household type, and job type by wage. It specifically focuses on the annual data for the years 2011 and 2012, which is the most recent data available at this time. [1] Local area unemployment statistics reveal the uneven impact the recession has had on the District.
Overall Unemployment
With the onset of the recession, unemployment levels rose across the United States, including DC. The District’s unemployment rate was at 5.5 percent in 2007 before rapidly climbing as the recession impacted the economy (See Figure 1). DC’s unemployment rate peaked in 2011, with 10.1 percent of residents unemployed. Since then, the overall unemployment rate has begun to slowly decrease to 8.9 percent in 2012; however, it still remains significantly higher than before the start of the recession.
To read the full report, click here.
[1] CPS data were accessed through Data Ferrett, which can be found at http://dataferrett.census.gov. Bureau of Labor Statistics, Local Area Unemployment Statistics, 2012 can be found at: http://data.bls.gov/timeseries/LASST11000003. The unemployment rates for specific groups are found using data from both CPS and BLS, while overall unemployment rate draws solely the BLS rate. The formula used is (CPS Data Ferret population subset unemployment rate / CPS Data Ferret city unemployment rate) * BLS DC unemployment rate.
