As 2024 comes to a close, DC Fiscal Policy Institute (DCFPI) staff handpicked our most insightful data visualizations of the year. They showcase the extent and harm of income and racial inequality in the District and point the way to building a more inclusive and stronger economy.
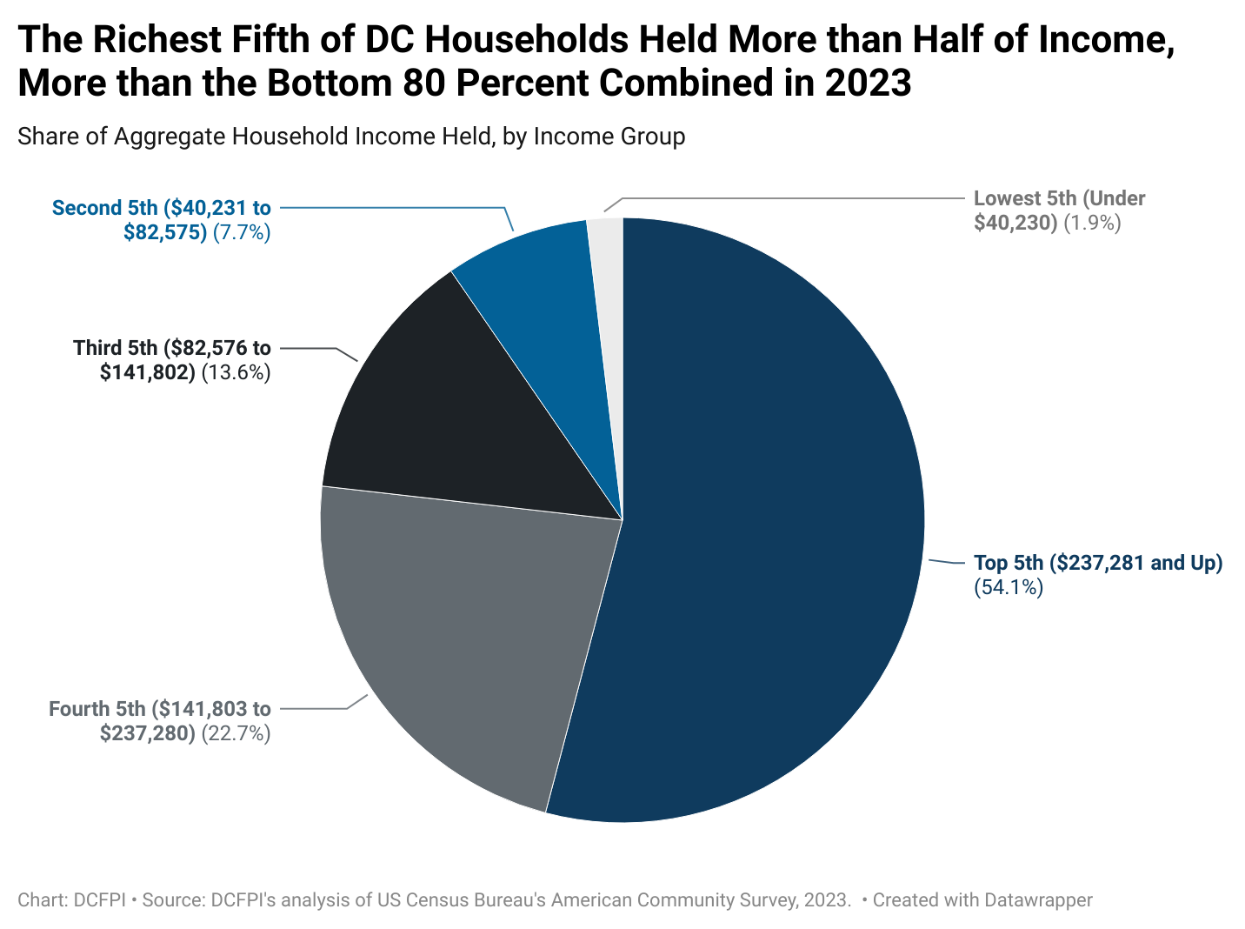
Figure 1: Extreme Levels of Income Inequality Held Strong
The District’s extreme levels of income inequality held strong in 2023, according to US Census data released in September. The richest 20 percent of households in the District—which are overwhelmingly white—took home more than half of total income, reflecting centuries of racist policy and practices. Higher levels of income inequality correlate to slower economic growth, harming all residents.
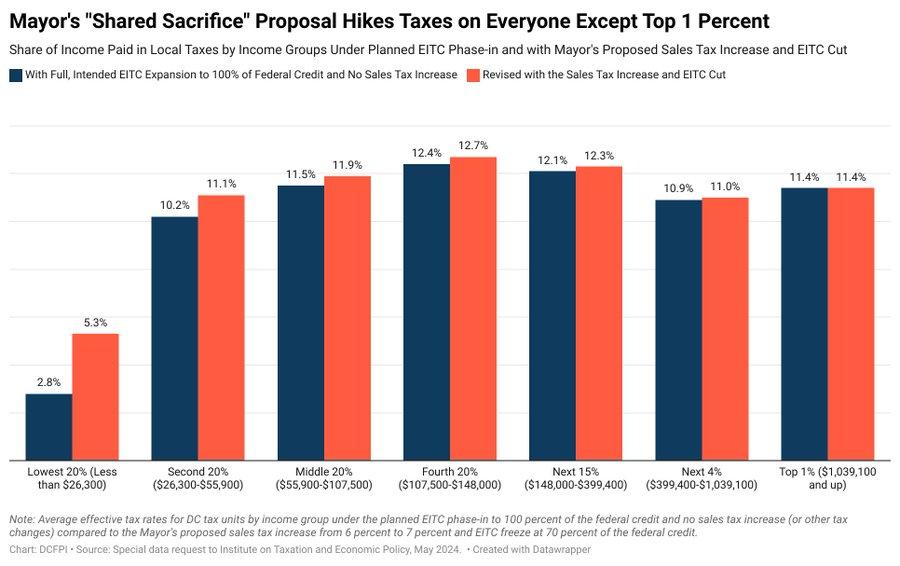
Figure 2: Inequality Would Have Worsened Under Mayor Bowser’s Tax Proposals
Despite high inequality, Mayor Muriel Bowser proposed two tax changes in her fiscal year (FY) 2025 budget that, when combined, would have raised the effective tax rate on all taxpayers except the top 1 percent. In fact, residents with the lowest incomes would have faced the largest tax hike. While the DC Council kept in place the mayor’s proposed sales tax increase, it restored the improvements to the DC Earned Income Tax Credit and taxed wealth more by raising taxes on high-value homes.
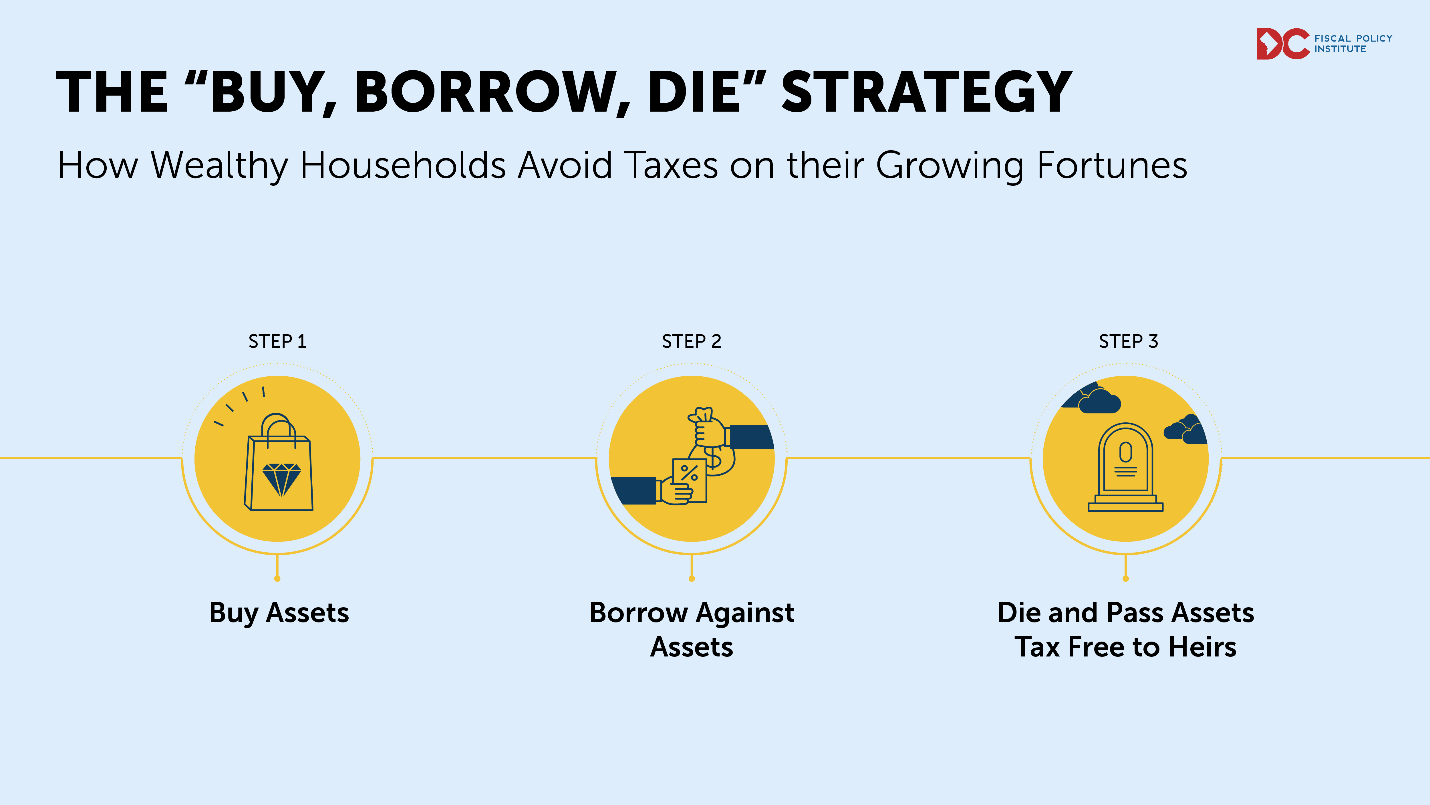
Figure 3: Ending Special Tax Treatment for the Wealthy Would Reduce Inequality, Boost Revenue
DC’s tax system includes many advantages for wealth, allowing it to concentrate in the hands of a few households. Wealthy households, for example, can use the three-step “buy, borrow, die” strategy to get massive capital gains tax advantages worth nearly $44 million each year. This strategy protects the inheritance of wealth, especially extreme wealth, allowing the very wealthiest families to hold, live off, and transfer that wealth without ever paying taxes on it. Racial justice requires taxing wealth more heavily to increase the District’s shared resources, so that everyone has what they need to thrive.
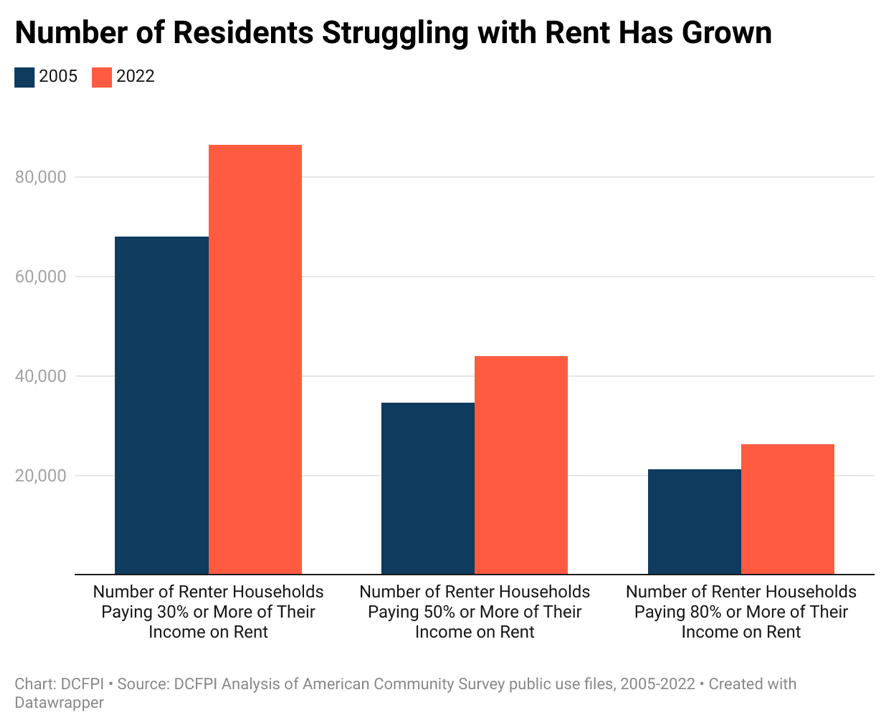
Figure 4: Rising Rents are Hitting DC Residents Hard
Taxing wealth at higher levels would allow DC to increase its investments in affordable housing at a time when the number of rent-burdened households, or households paying over 30 percent of their income on rent, has increased drastically. Similarly, the number of renter households paying 50 percent or more of income on rent increased by 27 percent since 2005. These startling increases reflect skyrocketing rents and a lack of affordable housing, and they are leading to displacement of native Washingtonians.
Figure 5: Spending Has Held Steady, but DC Needs More Revenue to Maintain Public Services
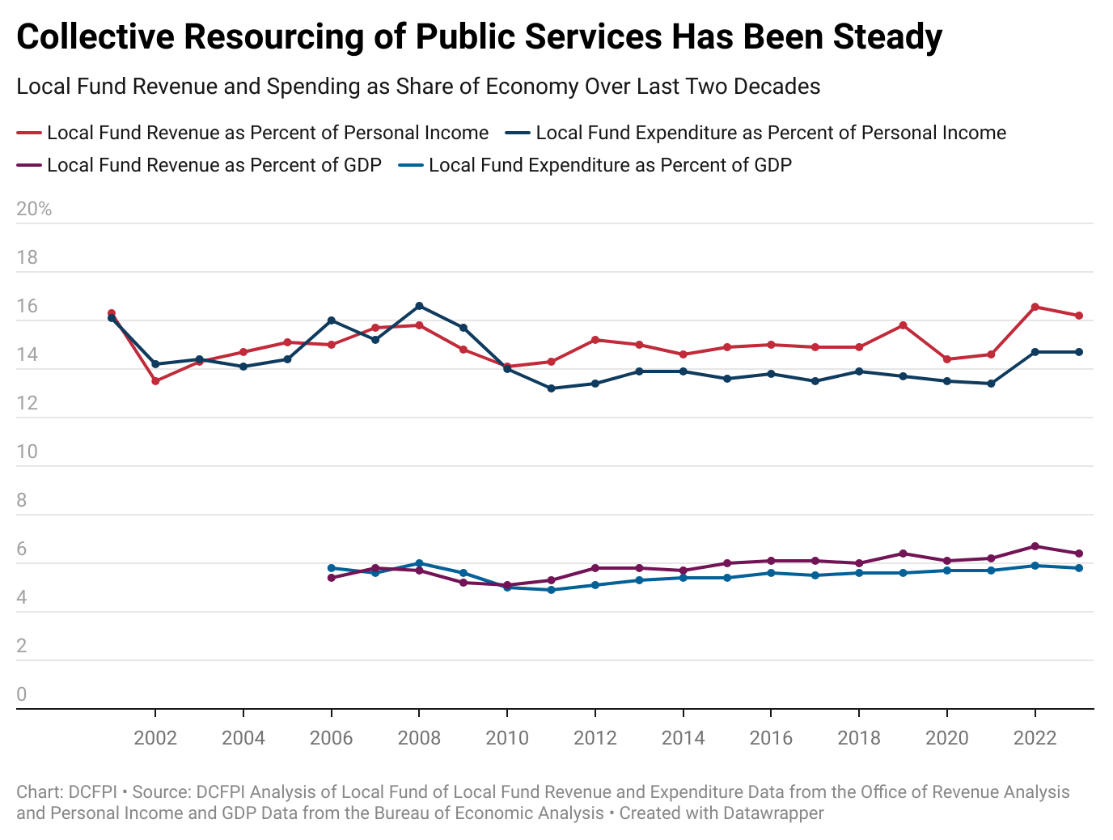
The budget is a powerful tool for addressing DC’s longstanding economic and racial inequities. Local revenue and spending have remained in line with economic growth, but when taken as a share of the economy, earlier this year DCFPI projected that it would decline sharply over the next four years unless lawmakers acted. Without sufficient revenue, DC lawmakers are jeopardizing their ability to adequately fund public services and invest in programs that reduce inequities.
Figure 6: Expanding Access to DC’s Child Care Subsidy Program Would Grow DC’s Economy
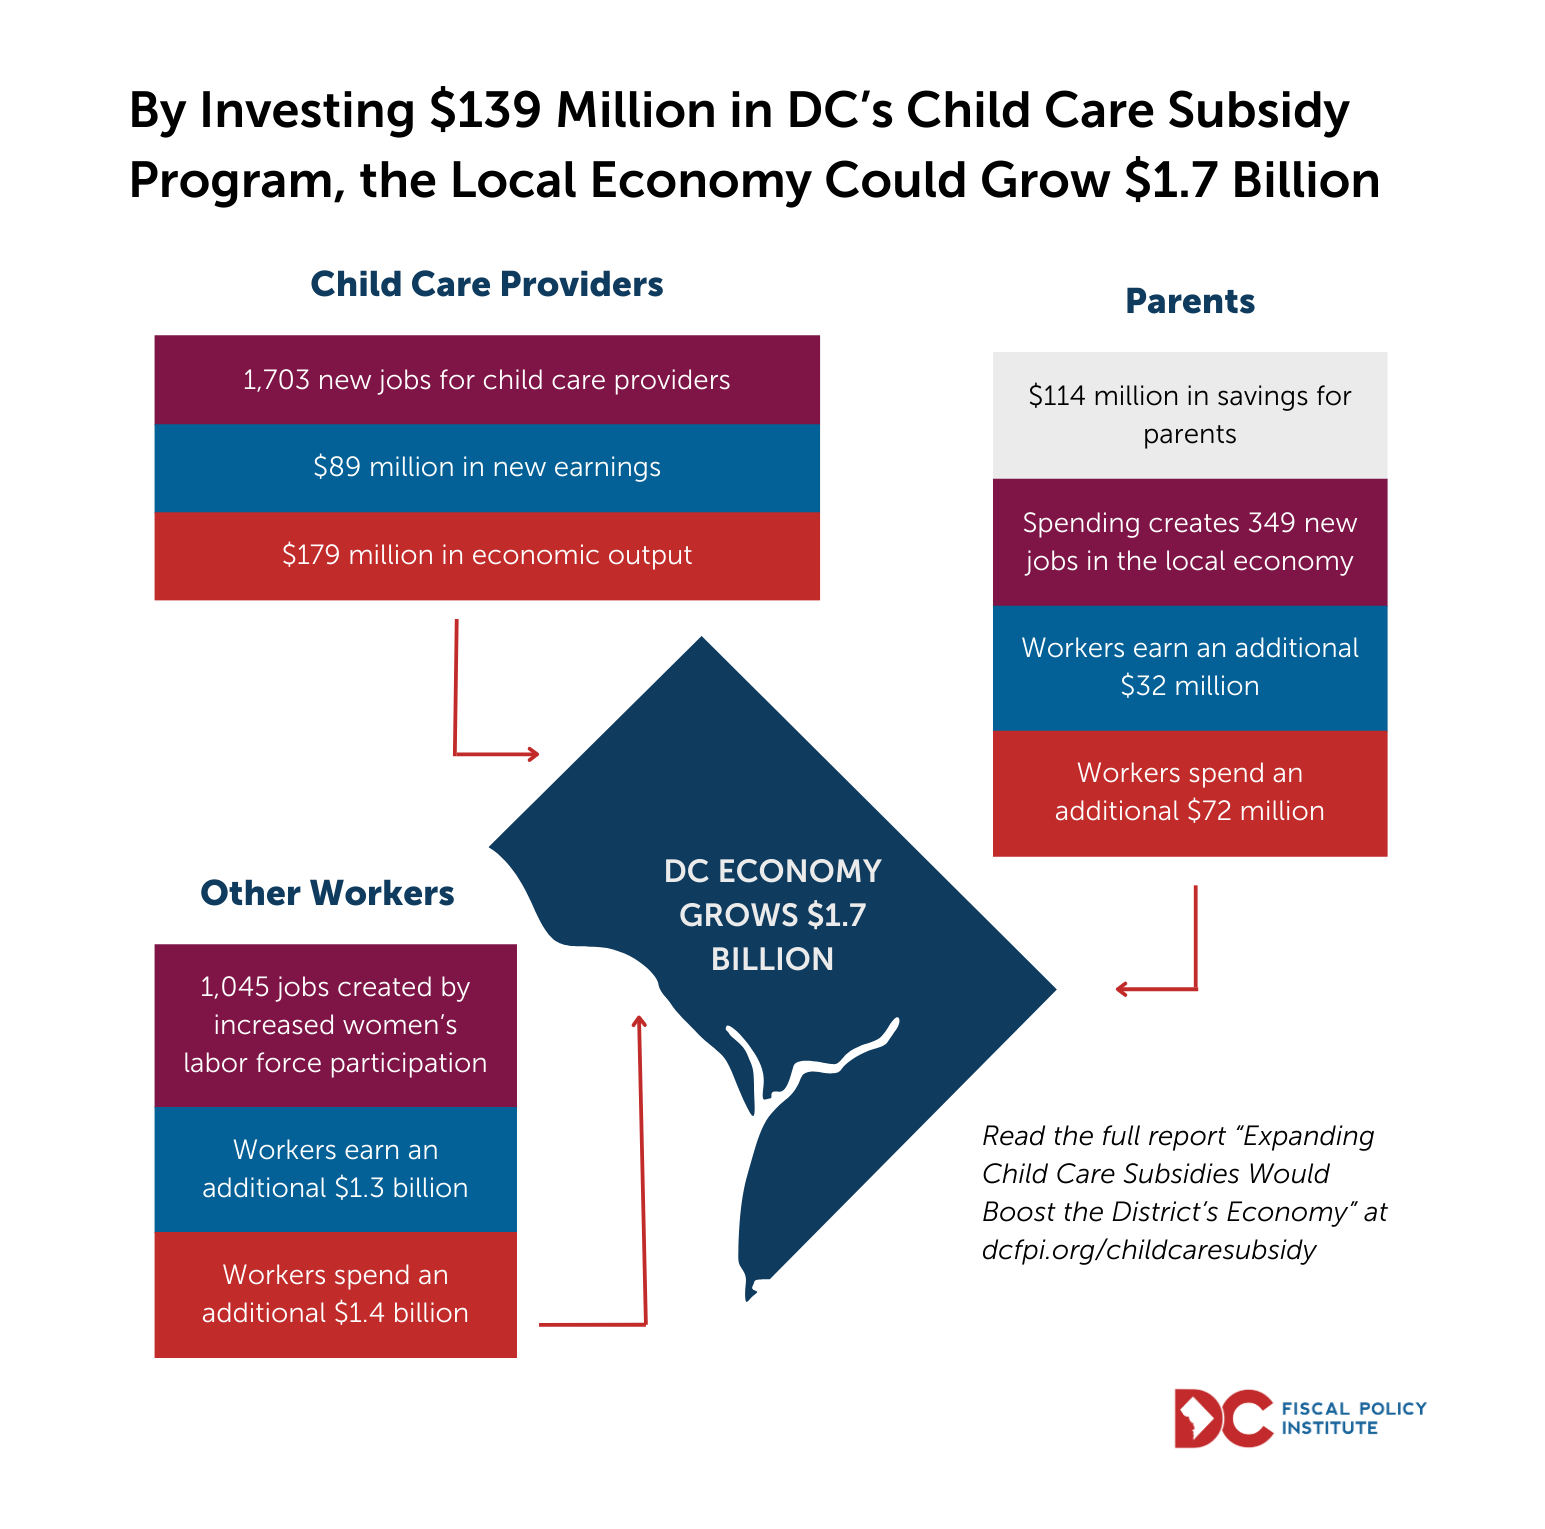 Thanks to an income tax increase on just 4 percent of DC’s highest earning residents, DC was able to make a transformative investment in early childhood development. By increasing pay for child care workers, the District has reduced teacher turnover, increased the number of child care slots, and improved care. Further investments to help all families pay for child care, regardless of income level, would boost DC’s economy by $1.7 billion by removing barriers to women’s participation in the workforce, freeing up family budgets to purchase more necessities from District businesses, and increasing the money child care providers have to overcome tight margins, hire more staff, and improve their facilities.
Figure 7: There are Stark Differences in Childhood Well-Being for Black and White Children 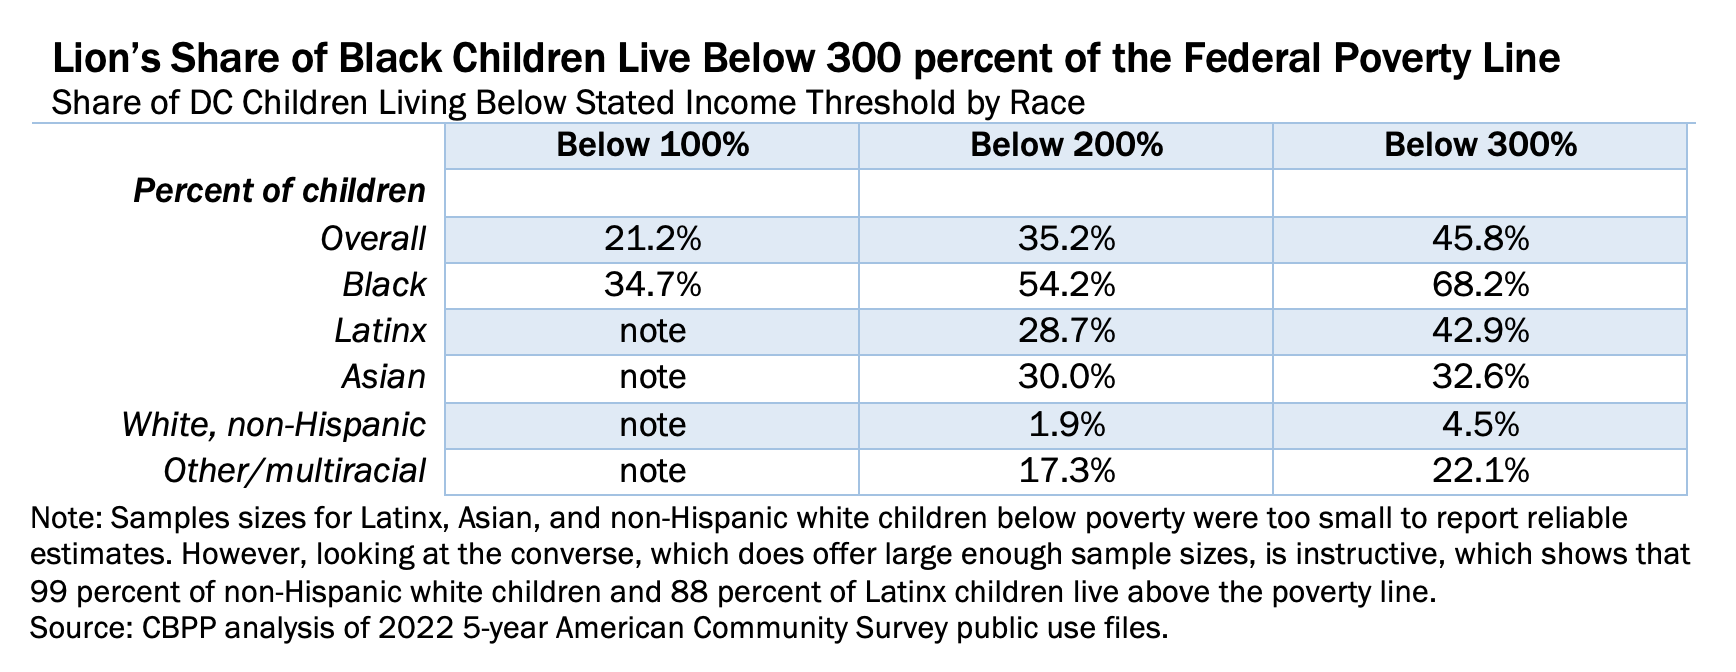
Child poverty is higher in DC than nationally and disparities between Black children compared with white children are extreme, leading to adverse health and unequal economic outcomes. More than one-third of Black children live in families with incomes below the poverty line, around $30,000 for a two-parent family of four. In stark contrast, virtually all (99 percent) non-Hispanic, white children live above the poverty line.
Figure 8: A Strengthened DC Child Tax Credit is a Tool for Tackling Child Poverty
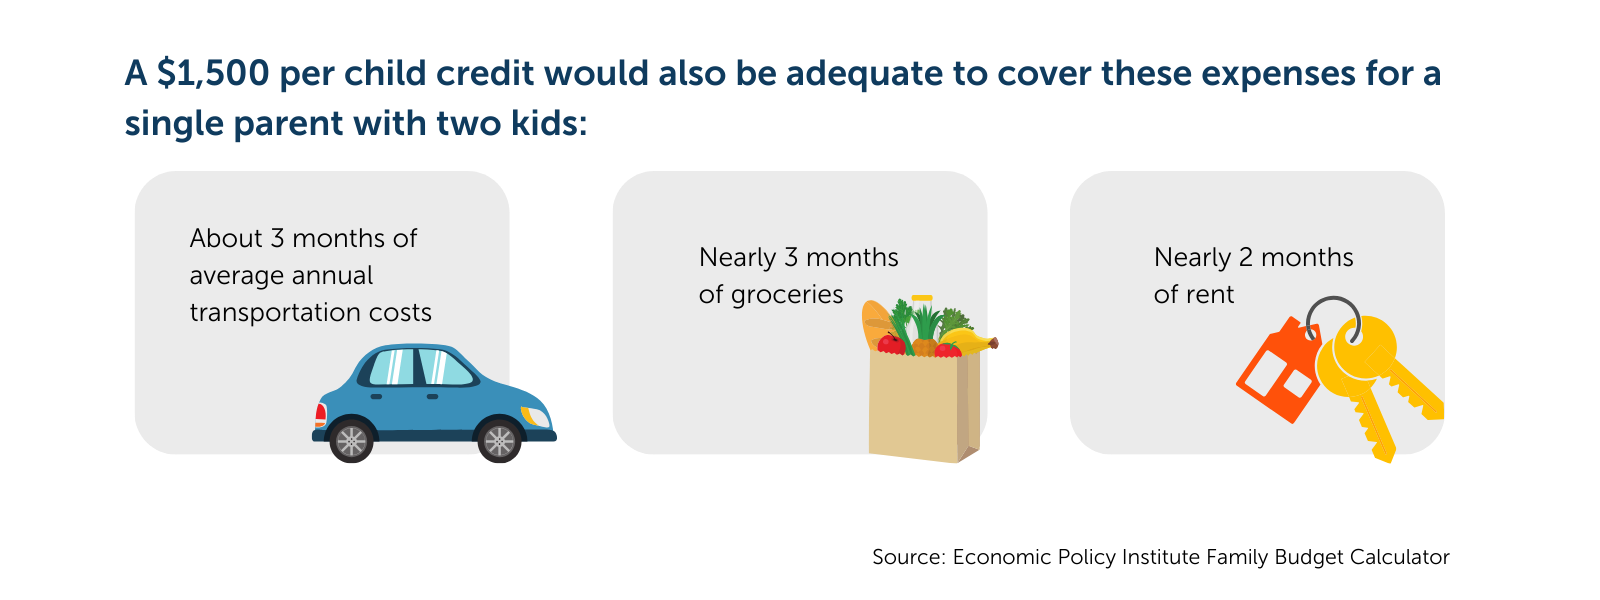 In its budget this year, DC Council adopted a local Child Tax Credit (CTC), which will help shore up cash resources for families. It is capped at $420 per child and will benefit 42,000 children under age 6. Lawmakers can strengthen the CTC by expanding the credit to $1,500 per child tax credit for all children under age 18 in families up to 300 percent of the official federal poverty line. For a single parent with two children, $1,500 would be enough to cover three months of transportation costs, three months of groceries, and two months of rent.
Figure 9: Young Workers Face Systemic Barriers to the Labor Market
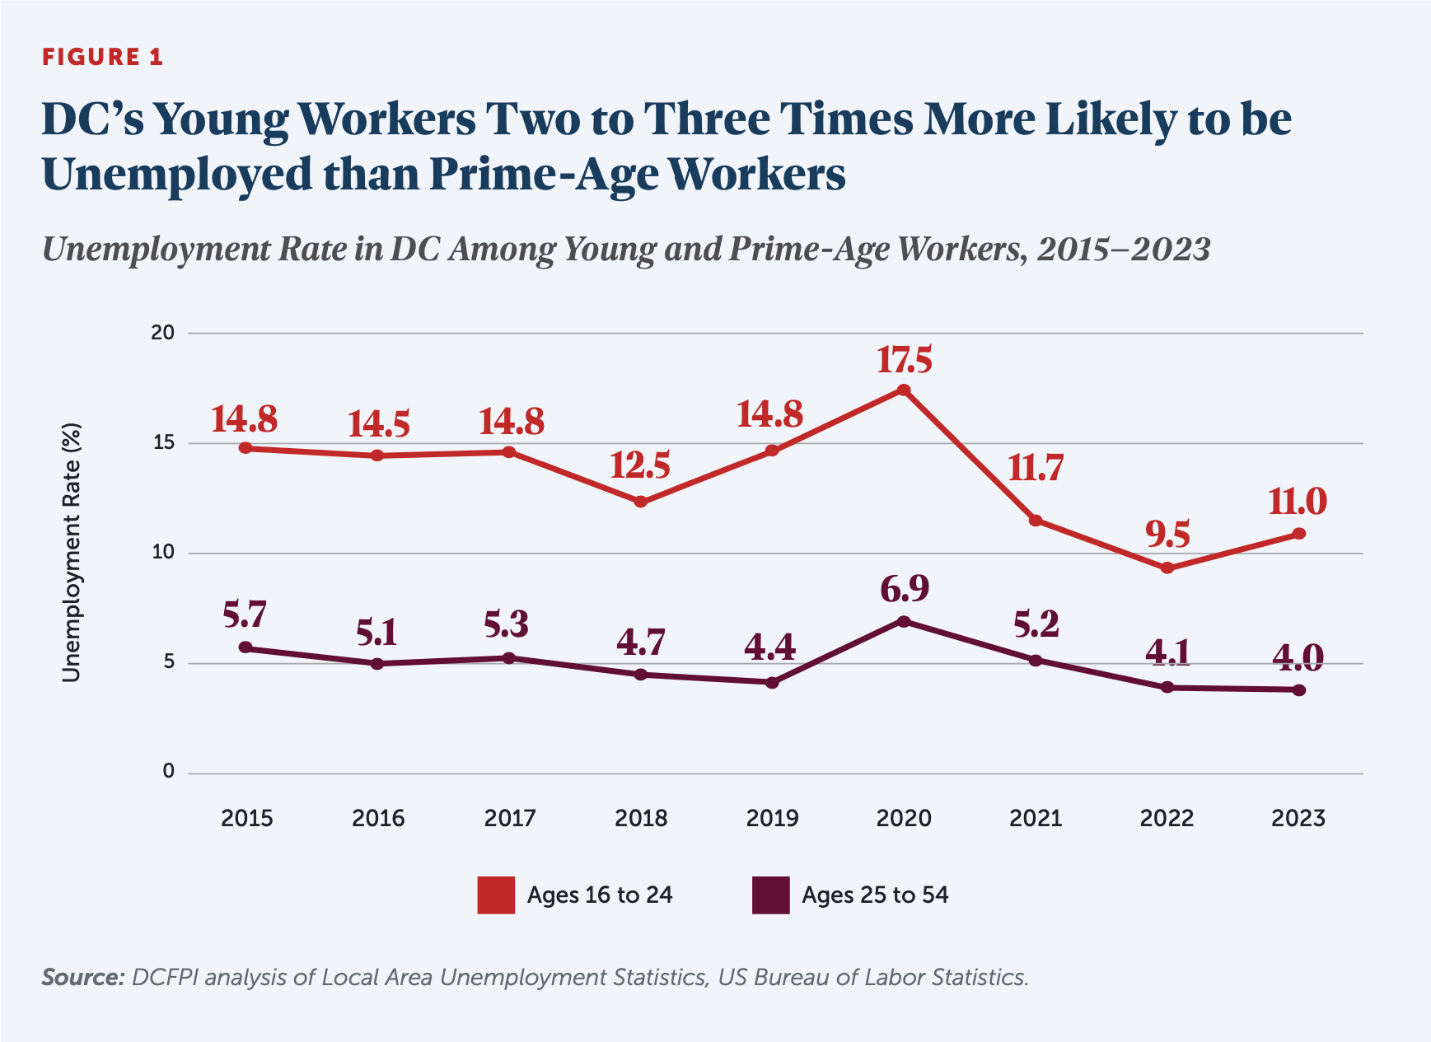
Residents ages 16-24 struggle to get a toehold in the job market and face significantly higher unemployment rates compared to workers ages 25-54. For the better part of the last decade, the unemployment rate among young workers has ranged from 2.3 to 3.4 times higher than workers ages 25-54. A person’s early working years are a critical time to acquire workplace skills, connections, and experiences that can lay the groundwork for a successful career and financial security.
Figure 10: Younger Unemployed Workers are Disproportionately Black
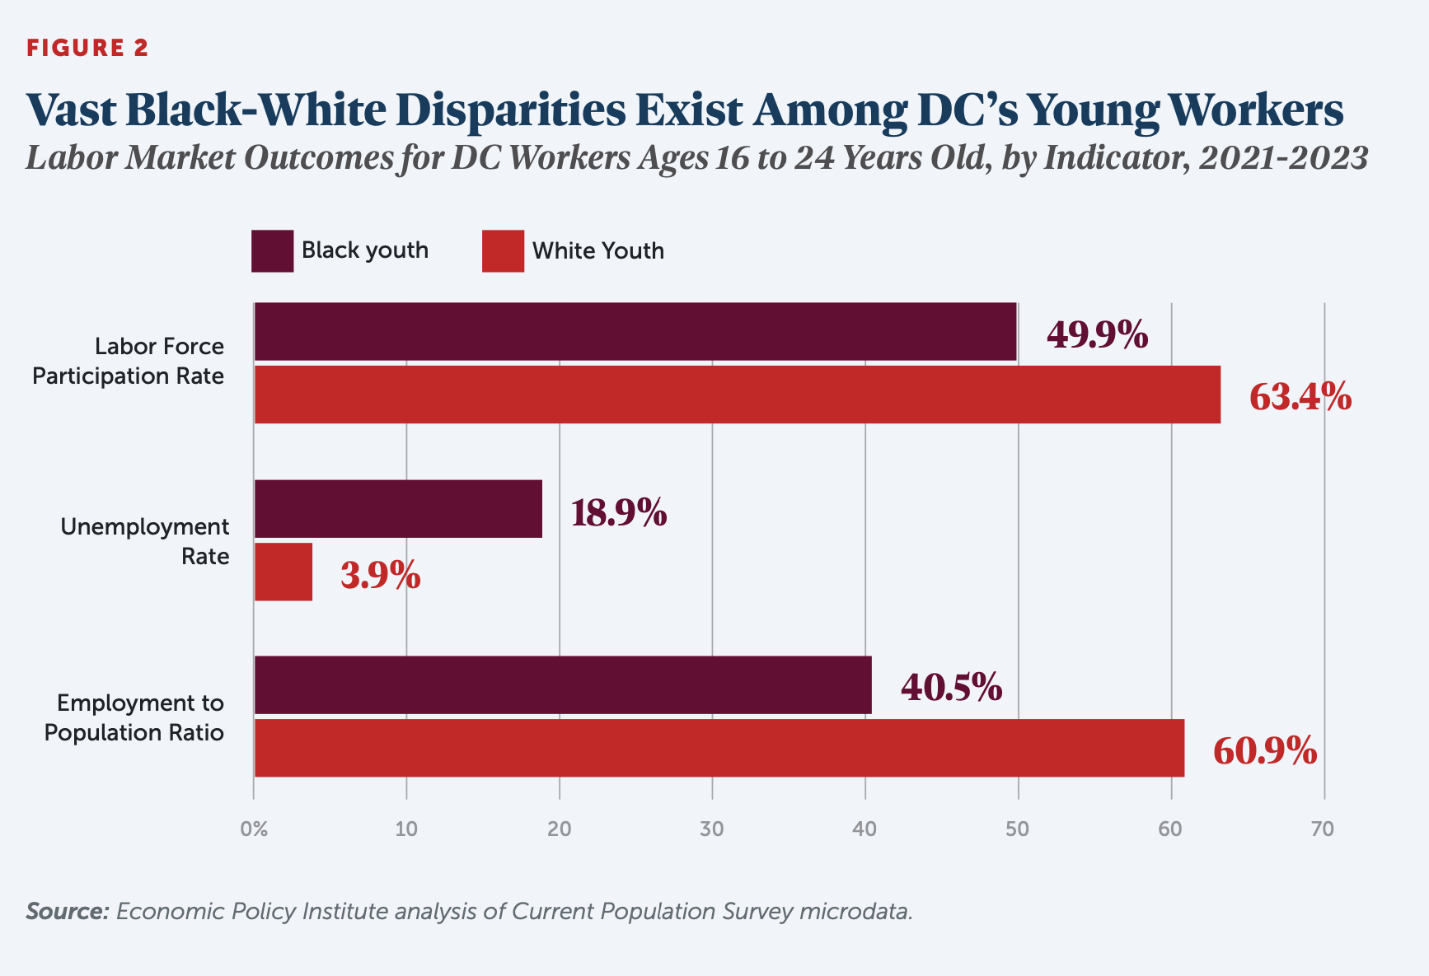
Black youth in particular face chronic labor market exclusion across employment indicators. For example, the Black-white youth unemployment ratio is nearly 5-to-1, and fewer Black youth are seeking or have a job than white youth. The disparities stem from historic and ongoing racism and discrimination in the labor market, which have led to the systemic exclusion of Black workers from employment and economic opportunity. A quality job guarantee would ensure DC youth can fully participate in DC’s economy.
Figure 11: Fines and Fees Related to Incarceration Place Economic Burden on District Families
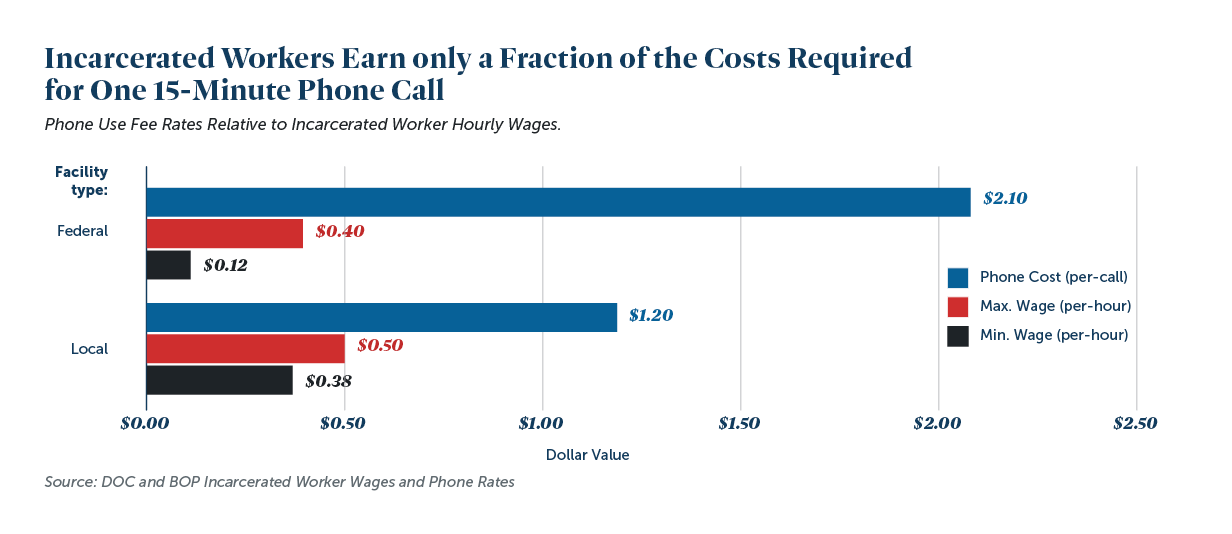
People who become involved with the criminal legal system—who are disproportionately Black because of deeply rooted anti-Black racism—are forced to pay a host of fines, fees, and other financial obligations at nearly every stage of the criminal legal process. This includes communications fees: In DC jails, the price of a 15-minute phone call was more than double the hourly earnings for someone incarcerated in 2024. Incarcerated individuals often cannot afford these costs on their own without outside support and families and loved ones often have to help pay them.
Figure 12: Federal Interventions are Insufficient in Relieving Economic Burden on Incarcerated Individuals
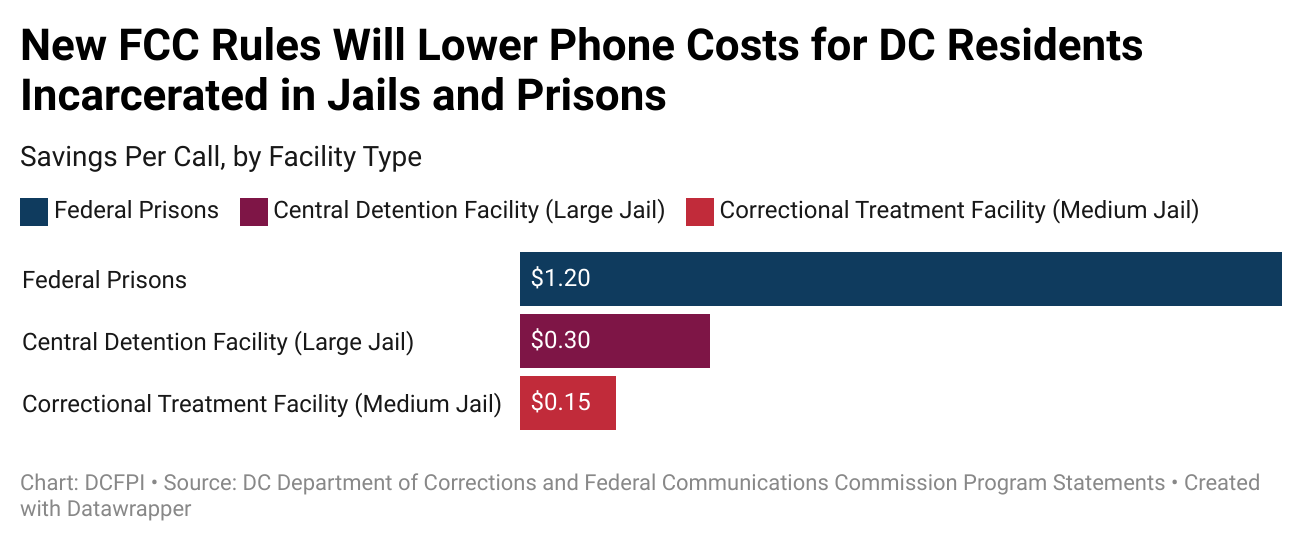
Jail and prison communication will become more affordable for DC residents following a recent federal rule change that will cap phone costs by more than half of former costs in jails and prisons across the US. For people in DC jails and their families, the new caps will reduce communication costs between $0.15 and $.30 for a 15-minute call. Even with these reductions, the price of the calls will remain a considerable burden on people who are incarcerated and continue to disproportionately harm Black families. DC lawmakers should consider funding a program that offers free calls to people incarcerated in its jails.

