Despite a growing economy, DC failed to reduce poverty overall and for children and Black residents in 2023, according to new data from the Census Bureau’s American Community Survey (ACS). Whereas poverty in DC remained statistically unchanged at 14 percent and median incomes stayed flat, white residents were the only racial and ethnic group to see income gains over the prior year. The data demonstrate that Mayor’s Bowser’s 2023 economic “comeback” strategy is failing to grow incomes broadly and improve racial income disparities. The data also reiterate that inclusive economic growth, not growth alone or solely in downtown, is the path to shared prosperity and everyone having what they need to thrive.
This stalled progress comes on the heels of DC achieving significant reductions in poverty in 2022, which resulted from now-expired federal funding in response to the COVID-19 crisis and DC strengthening public investments in residents and anti-poverty programs. No improvements in poverty reduction and stalled progress for Black residents provide clear evidence that lawmakers should recommit to substantial and targeted investments in vital lifelines and racial and economic equity, rather than backtracking on funding for efforts that reduce structural inequities.
DC Poverty Reduction Was Uneven Across Racial Groups in 2023
In 2023, there were more than 91,000 District residents living in poverty under the official poverty measure—that’s enough to fill the Nationals Park stadium twice. (For an explanation of the official poverty measure, see ‘Temporary Quirk in the Supplemental Poverty Measure Understates Progress Against Poverty’ below.) The new data show deep and longstanding racial inequities: the unchanged DC poverty rate in 2023 appears to be driven by lawmakers’ inability to reduce poverty among Black residents. Due to systemic racism, historical and ongoing discrimination, and barriers to opportunity, Black people make up more than 3 in 4 DC residents experiencing poverty. Based on the official poverty measure, in 2023:
- The poverty rate among Black residents remained statistically unchanged from 2022 at 26.1 percent. This means more than 1 in 4 Black residents experienced poverty, and Black poverty was 12 percentage points higher than the rate overall.
- The poverty rate among non-Hispanic white people remained low at 4.2 percent, and down considerably from 5.9 percent in 2022.
- The poverty rate among Latino residents was 5.2 percent in 2023. This is a decline compared to 2022. However, small sample size and high margins of error make the estimates for both years and the magnitude of the change unreliable.
- The child poverty rate also remained unchanged from 2022 but continues to be high at 16.9 percent. Reliable data on child poverty by race and ethnicity will be available in December, when the ACS releases its five-year estimates.
Moreover, the District’s stark racial disparities in the poverty rate are chronic. Over the last decade (2013 to 2023), the Black poverty rate never dipped below 21.3 percent and was as high as 28.7 percent. In other words, at least 1 in 5 and sometimes more than 1 in 4 Black residents lived in poverty in any given year over the last decade, underscoring persistent economic hardship and disadvantage. That stands in stark contrast to the experience of white residents, whose poverty rate over that timeframe never reached 8 percent (or about 1 in 13) and shrunk to its lowest level of 4.2 percent (or about 1 in 24). Being born and raised in persistent poverty (as opposed to short stints of poverty) damages children’s long-term outcomes, and there is even greater harm when those children grow up in high-poverty neighborhoods where the cumulative harm of hardship is magnified, particularly for Black communities.
Racial Income Disparities Deepened in 2023 As Economy Delivered Gains to White Households and Stalled Progress for Black, Latino, and Asian Communities
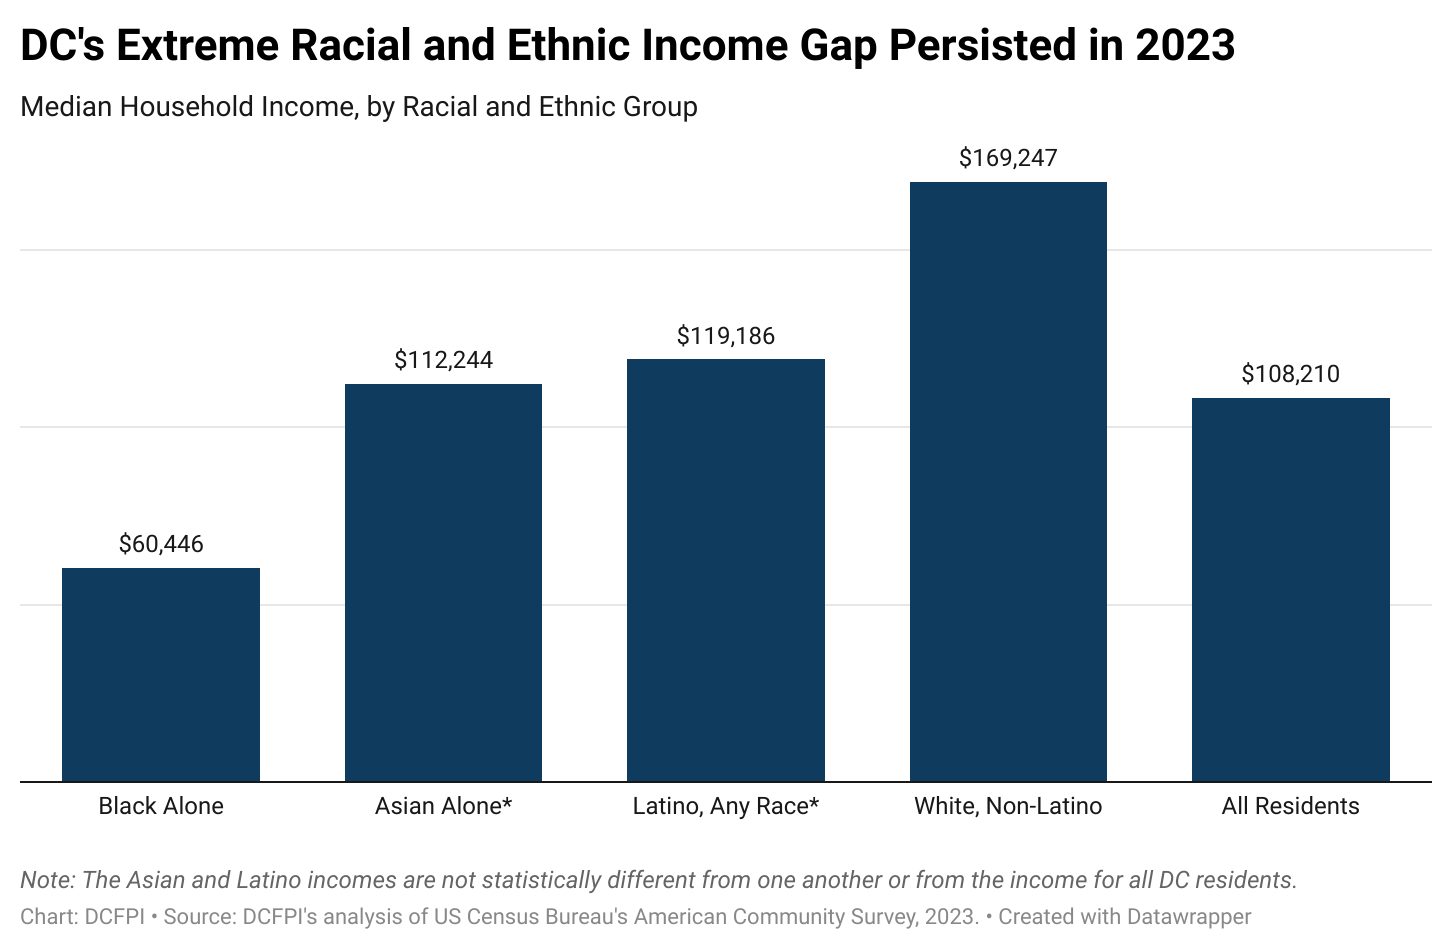
In 2023, DC median household income also remained statistically unchanged from the year prior ($108,210 compared with $105,195 in 2022, when adjusted for inflation), despite an improving economy and steady increases in the minimum wage (Figure 1). Half of all households in the District have income above the median income and half have incomes below it.
Median income in the District has not improved since the start of the pandemic, when adjusting for inflation. 2023 data shows worsening racial and ethnic income disparities for DC:
- Median income for Black households, $60,446, remained statistically unchanged from 2022.
- Median income for Asian households, $112,244, also remained statistically unchanged from 2022.
- Median income for Latino households, $119,186, also remained statistically unchanged from 2022. High margins of error for estimates for this group may also make this data unreliable.
- Median income for white, non-Hispanic households, $169,247, increased by nearly $12,000 from 2022 and is the highest among all other racial and ethnic groups. It is 2.8 times higher than for Black households, which represent the single largest racial group in the District.
A longer lookback, however, shows DC has slowly reduced racial income disparities as it recovered from deep economic downturns. Median household incomes have grown for both Black and non-Hispanic white households in DC since 2013, by 20.7 percent and 8.8 percent, respectively, after adjusting for inflation. Despite the greater progress for Black households, it falls far short of achieving parity. White household income remains nearly three times higher than Black household income in 2023 and has been anywhere from 2.5 to 3.4 times higher than it has for Black residents over the past decade.
Extreme Levels of Income Inequality Held Strong
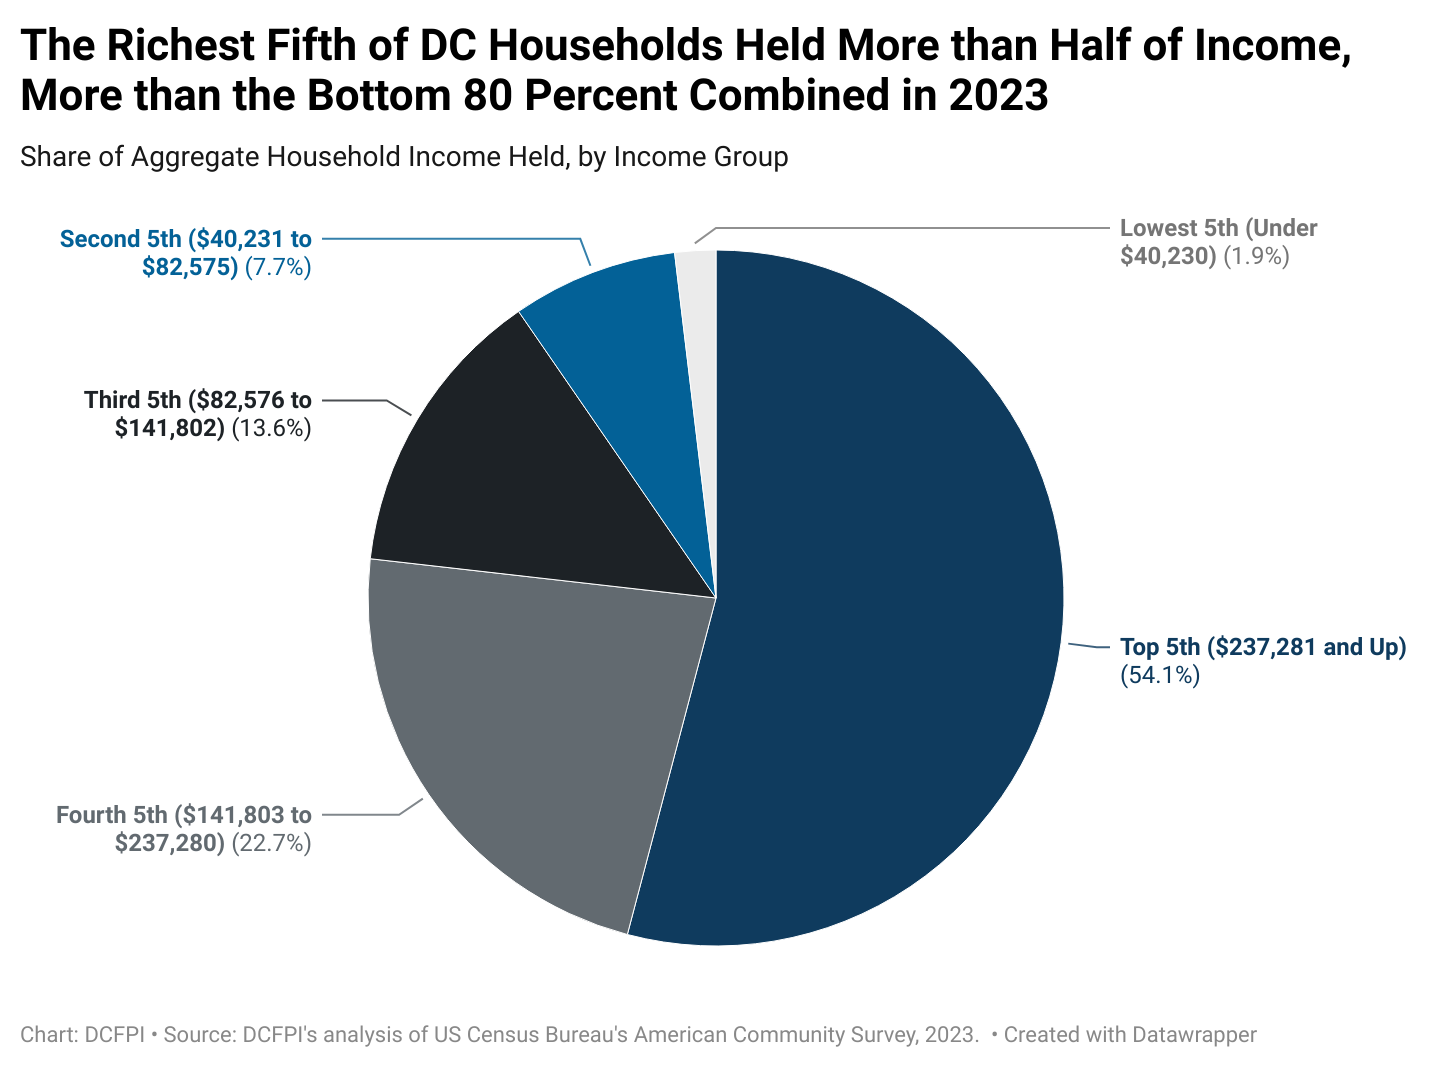
Lastly, DC’s extreme levels of income inequality held strong in 2023, with households at the top end of the economic ladder capturing a majority of income generated by DC’s economy. Households in the top fifth of the income distribution—who are overwhelmingly white—captured 54 percent of all income in 2023, leaving less than half of the income for everyone else in DC (Figure 2). Compare that to 1.9 percent of income held by the lowest-paid 20 percent of households, who are mostly Black and brown.
Income is even more concentrated at the very top, with the highest-paid 5 percent making off with nearly 1 in every 4 dollars of income generated in 2023, or roughly the same amount of income as the bottom 60 percent of households combined. In fact, under a key Census measure of inequality (known as the “Gini coefficient”), DC tied with New York for having the highest levels of income inequality in the nation except for Puerto Rico.
These persistent levels of income inequality threaten DC’s economy and social fabric and undermine our path towards shared abundance, in part because income inequality has been found to slow growth and lengthen the time it takes for economies to recover from downturns or other shocks. While Mayor Bower’s Economic Comeback Plan set a goal of lifting the median Black household income by 25 percent, she continues to cut funding from transformative programs that improve racial justice and economic security. Together, this year’s Census report underscores the need for the mayor and DC Council to recommit to efforts that reduce poverty, grow incomes more broadly, and eliminate racial injustices.
Temporary Quirk in the Supplemental Poverty Measure Understates Progress Against Poverty
ACS uses the official poverty measure (OPM) to determine the poverty rate, which experts generally agree is an outdated method for measuring hardship in the United States. The OPM compares pre-tax cash income, including income from earnings, unemployment insurance, and cash-based public assistance, against a threshold that is set at three times the cost of a minimum food diet in 1963 and adjusted for family size. The OPM does not take into account other vital supports that individuals and families in the District may receive, such as the Child Tax Credit or Supplemental Nutrition Assistance Program (SNAP) benefits, nor does it account for the substantial variation in cost of living by geography.
The Census also offers a Supplemental Poverty Measure (SPM), which includes tax credits and non-cash benefits like SNAP in calculating income and sets a threshold based on a fuller range of living expenses, including housing, in a given calendar year. Three-year state-level data for 2021 to 2023 shows that the poverty rate in the District is statistically the same across the OPM and SPM. The SPM also suggests that DC made no progress on overall poverty reduction over the previous 2020 to 2022 three-year period. Lawmakers invested in significant economic supports during the pandemic and its aftermath that reduced racial and ethnic inequities and drastically drove down child poverty to a record low in 2021, making flat progress unlikely.
In fact, the new SPM results should be viewed with caution due a sharp upward adjustment to its threshold (or “poverty line”) between 2022 and 2023 that are causing the data to understate poverty improvements, according to experts. The SPM threshold fluctuates each year to reflect what typical households spend on basic needs, such as food and housing, averaged over five years. Because household spending spiked during the pandemic, the thresholds also spiked, and for renters, at more than twice the inflation rate based on the traditional consumer price index (which is what guides changes in the OPM). When the thresholds are higher, it makes it harder on paper for residents’ resources to pull them out of poverty, not because there were necessarily real declines in their resources in inflation-adjusted terms. The US Census created an alternative SPM measure for 2023 that starts with the 2022 thresholds and only adjusts for inflation, and they found fewer Americans were in poverty, suggesting that economic supports and aid are continuing to reduce poverty.