DC Must Grow Revenue and Spending to Pursue More Transformative Change
By Erica Williams • May 1, 2024 • Revenue & Budget / Taxes
Public spending through the budget is the foundation of a strong economy. Taxes and other sources of revenue make up the collective resources the District needs to maintain roads and reliable public transportation, create affordable housing and wealth building opportunities for residents, fund quality public schools and parks, culture, and recreation. The budget is also a powerful tool for addressing DC’s longstanding racial inequities, and DC lawmakers have made meaningful investments in transformative solutions to big social problems—among them, leading programs in early childhood development and ensuring residents have access to health care.
While the District’s revenue and spending has largely held flat over the past two decades, when taken as a share of the economy, it is projected to decline sharply over the next four years. Without intervention to ensure spending keeps pace with growth in the economy, DC lawmakers are jeopardizing their ability to adequately fund public services. Spending needs to keep up with real growth in the economy beyond inflation and population for the District to be able to meet community needs and recruit and maintain public employees and contractors. The District will struggle to find teachers, first responders, and other employees willing to take on core service-providing jobs if spending on those services increases so slowly that it holds down wages.
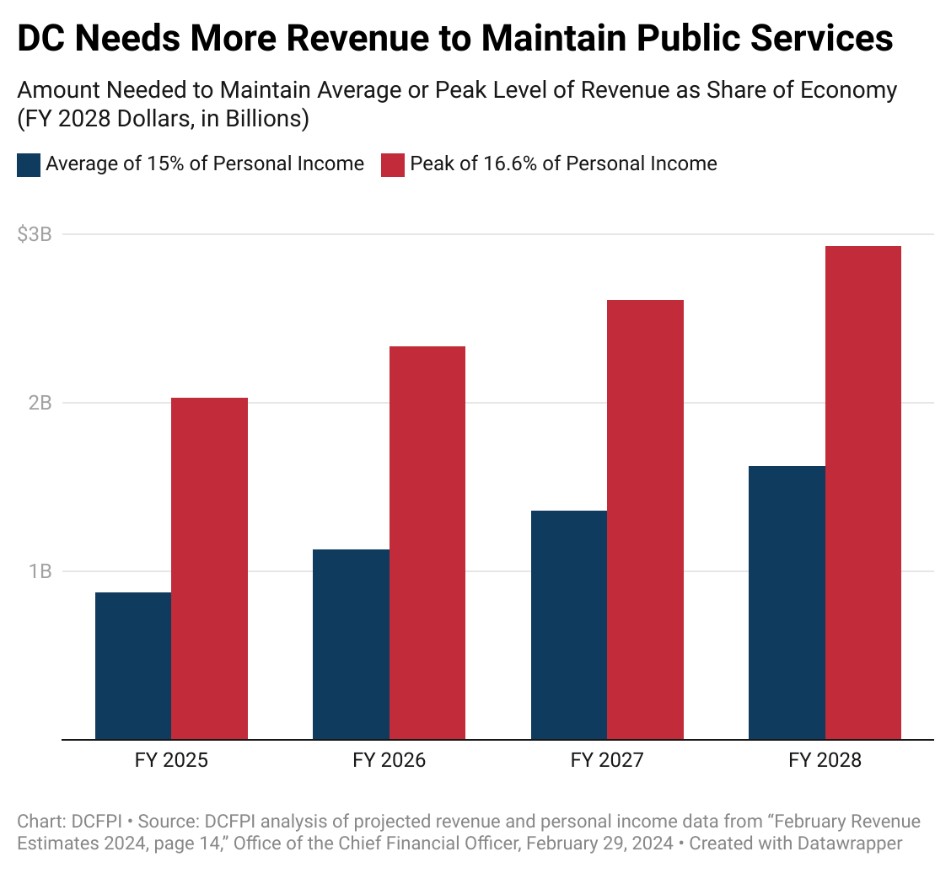
DC will need $1.6 billion more in revenue by fiscal year (FY) 2028 to maintain its average level of spending as a share of the economy. Some of this revenue may materialize if economic factors improve or the District’s revenue projections prove overly pessimistic. Otherwise, DC lawmakers will need to raise this amount at minimum to keep up with needs and the natural growth in the cost of providing current services.
At the same time, undoing racial and economic inequities that were centuries in the making will take a sustained, long-term effort in the face of broad economic forces at play that actively slow our progress. With $2.9 billion more in revenue by FY 2028, the District would match its peak level of Local Fund revenue as a share of the economy in FY 2022, during which time census data show DC made progress on reducing hardship. With these additional resources, the District can chart a new course. District leaders could end chronic homelessness—a key step in repairing one of the deepest harms of centuries of structural racism and discrimination—end child poverty, prevent DC residents from being displaced by the rising cost of housing, ensure affordable child care for all families, and build Black wealth by increasing Black homeownership. Letting revenue fall relative to economic growth will only cause DC to backtrack on its promises and lose ground on its achievements to creating a thriving, racially and economically equitable District.
Public Spending is the Foundation of a Thriving Economy
The District’s budget is a primary tool for creating the thriving DC where people want to live. Through the budget, DC funds essential public services that residents and businesses rely on every day. For example, accessible and affordable child care sets kids up for success and allows parents to work. Reliable public transportation and safe roads move workers, tourists, and goods around the city.
Public investment through the budget is the foundation of an economy that offers many residents good-paying jobs, home ownership and wealth-building opportunities, and vibrant cultural experiences. The DC budget is also a powerful tool for ensuring every resident has their basic needs met and can access educational, employment, and other opportunities to live out their dreams. Ensuring that all residents benefit from DC’s economy and prosperity, however, requires intentional policy choices.
DC prides itself on leading among jurisdictions—state or local—in public investments that advance more racially equitable outcomes. For example, nowhere else offers public pre-kindergarten (Pre-K) as universally as the District. And, DC offers health care for those ineligible for Medicaid, like many immigrants, a dedicated funding source for affordable housing production, and a local Earned Income Tax Credit (EITC) that includes undocumented workers and is set to fully match to the federal credit, among other achievements.[1]
This commitment to advancing racial and economic equity is one reason why it’s difficult to compare DC’s budget with that of other cities. Another reason is that DC is a unique jurisdiction with the responsibilities of both local and state governments. No other city, for example, is responsible for the state share of human services, like Medicaid or Temporary Assistance for Needy Families (TANF), or the state’s share of education spending. Likewise, no state is responsible for the full range of local services DC provides like trash collection, police and fire protection, park maintenance, and local economic development.[2]
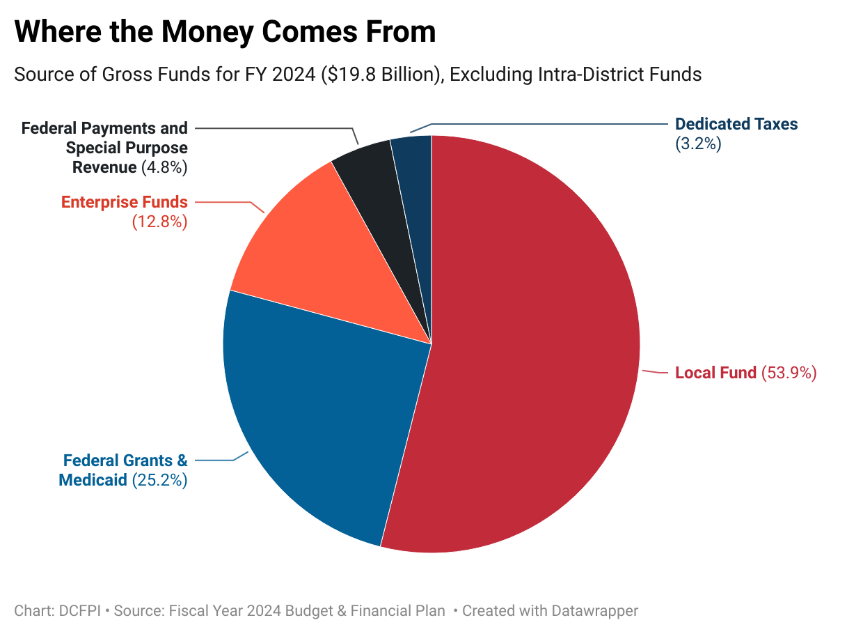
Often, it is the size of the Gross Funds budget (sometimes called the operating budget) that gets cited and compared with the budgets of other cities, even though, as noted above, it encompasses the responsibilities of local and state-level government. The Gross Funds budget includes spending from Local Funds, which encompass income, property, and sales taxes as well as some fees and fines (Figure 1). The Local Funds portion of the operating budget is the primary focus of spending decisions in each year’s budget session. The Gross Funds budget also includes more than $5 billion in federal funds, the size and purpose of which DC has minimal control (and which expanded in recent years in response to the pandemic), and around $4 billion in other funds raised through more narrowly targeted or specific taxes or fees that pay for specific enterprises or purposes and that are not typically subject to annual legislative changes (Appendix I).
Figure 1
In addition, the District has a capital budget that is primarily funded through bonds (78.6 percent), but also includes federal funds and a relatively small transfer of funds from the operating budget known as “Pay-As-You-Go” (Paygo), all of which supports building and maintaining DC’s infrastructure such as roads and schools.[3]
To better understand growth in the DC budget, the following analysis focuses on trends and projections in DC’s Local Fund revenue and spending, which is a primary focus of DC budgeting and reflects what’s done each year with the three largest local taxes paid by residents each year.
DC Local Fund Budget Has Held Steady Over Last Two Decades, As A Share of the Economy
The Local Fund budget is powered by DC’s three broad-based local taxes—its income, sales, and property taxes—as well as certain fees and fines, and amounts to about $10.7 billion in FY 2024. DC’s Local Fund budget has held largely steady over the past two decades, according to a standard method of analysis that accounts for a jurisdiction’s fiscal capacity—that is, revenue and spending as a share of the economy. This measure reflects the ability of an economy to sustain or grow its taxes and public investments based on the health of the economy.
In this analysis, the DC economy is best measured by personal income, which focuses on all income received within DC’s boundaries and is therefore reflective of the capacity of DC residents to resource collective needs (Appendix II). Gross Domestic Product (GDP), or the final value of goods and services produced within a jurisdiction, can also be used as a measure of DC’s economy and captures economic activity more broadly, including that generated by non-residents and certain businesses owned by non-residents, who do not currently pay into DC’s personal or business income tax system.[4]
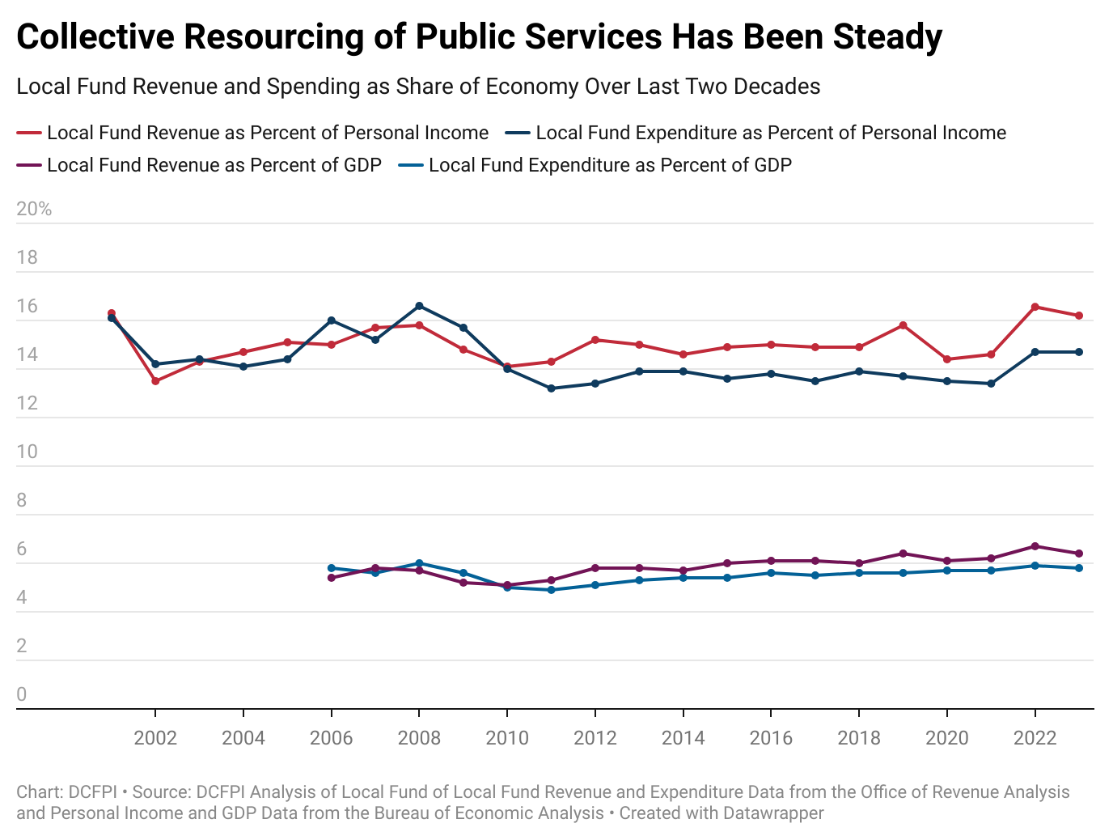
Using either measure of the economy, this method of analysis anchors the level of spending and revenue in key factors captured by changes in the economy like growth in population, incomes, costs of providing services, and productivity. Figure 2 offers a view of the trend in the District’s Local Fund revenues and expenditures as a share of both personal income (since FY 2001) and GDP (since FY 2006).[5] Since FY 2001, spending and revenue have remained fairly steady relative to DC’s economy, when taken as a share of personal income.[6]
Local Fund revenue typically ranged between 14 to 16 percent, averaging 15 percent, with a few instances of jumps and dips during and after recessions.
Local Fund spending, similarly, most typically ranged between 13 and 15 percent, or 14 percent on average, with small jumps and dips during and following recessions.
While not the peak, Local Fund spending was higher as a share of the economy in FY 2001, the final year of the federally mandated Control Board, than it was in FY 2023.
The trend line is even smoother when using GDP for the District from 2006 to 2023.
Local Fund revenue as a share of GDP ranged from the 5-7 percent during that time range, hitting an average of 5.9 percent.
Local Fund spending ranged between 5 to 6 percent, averaging 5.5 percent during that timeframe.
These trendlines underscore that DC’s local spending and revenue has not outgrown, but rather kept pace with, growth in the economy.
Figure 2
Without Policy Change, Local Fund Revenue Projected to Decline Relative to the Economy
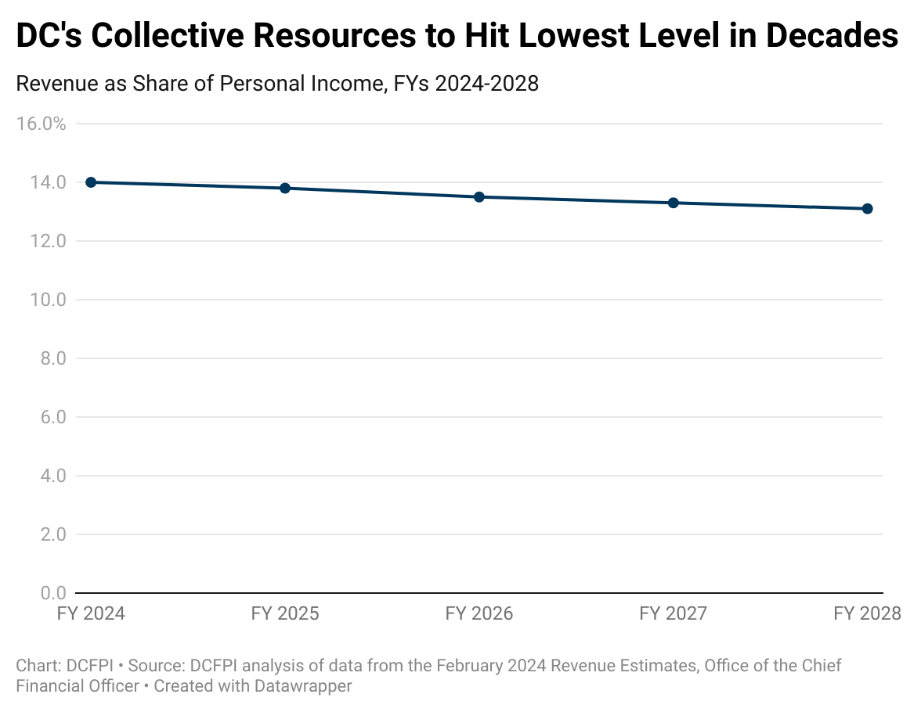
Looking ahead across the District’s four-year financial plan, the Local Fund budget is projected to decline as a share of the economy (Figure 3). DCFPI analysis shows revenue growing more slowly than the economy, when examining Local Fund revenue and personal income projections from the Office of the Chief Financial Officer’s February 2024 revenue estimate.[7] This is due to somewhat pessimistic forecasts for indicators like employment, commercial property tax collections, and interest rates. According to the projections, Local Fund revenue could drop to as low as 13.1 percent from 14 percent of personal income by FY 2028. That is lower than any other year over the 22-year period DCFPI analyzed. In other words, growth in the economy will outpace growth in revenue and lead to a decline in DC’s ability to fund public services that support a thriving economy.
Figure 3
At a minimum, DC lawmakers should set a course to raise enough revenue to maintain the average level of revenue as a share of the economy seen over the last two decades, or 15 percent (Figure 4). That would increase revenue by $1.6 billion in the last year of the financial plan, FY 2028, in real terms. Lawmakers also should consider going further and moving toward the peak level of revenue in FY 2022, which was 16.6 percent of the economy. That would mean $2.9 billion more than projected by FY 2028.[8] In either case, some revenue growth may come naturally without tax changes, should the economy or incomes grow faster, or if tax collections rise. For example, if interest rates come down, that could spur a greater volume of property sales and increase property tax revenue beyond projections in the coming years.
DC’s budget is foundational to residents’ quality of life, which for many is very high. No resident wants to see less investment in parks, recreation, roads, schools, or other amenities they rely on daily. In addition, chronic hardship experienced largely by Black and brown residents requires District lawmakers to do more, not less.
Figure 4
Other Measures of DC Budget and its Growth Tend to Exaggerate the Reality
The $19.8 billion Gross Funds budget is often compared with prior years in nominal terms to demonstrate how much the budget has grown.[9] The Gross Funds budget, however, includes a large amount of federal funds and narrow tax revenue dedicated to specific purposes. But even when focused on the Local Fund, which is the portion of the budget most actively debated through the annual legislative process, looking at revenue and spending over time in nominal terms will produce an exaggerated picture of budget growth. That’s because it fails to account for changes in key factors like the rising costs of providing services and the additional needs that come with a growing population. With more economic activity and more people, or with growing incomes, for example, a jurisdiction should expect needing to make additional investments in infrastructure, programs, and services.
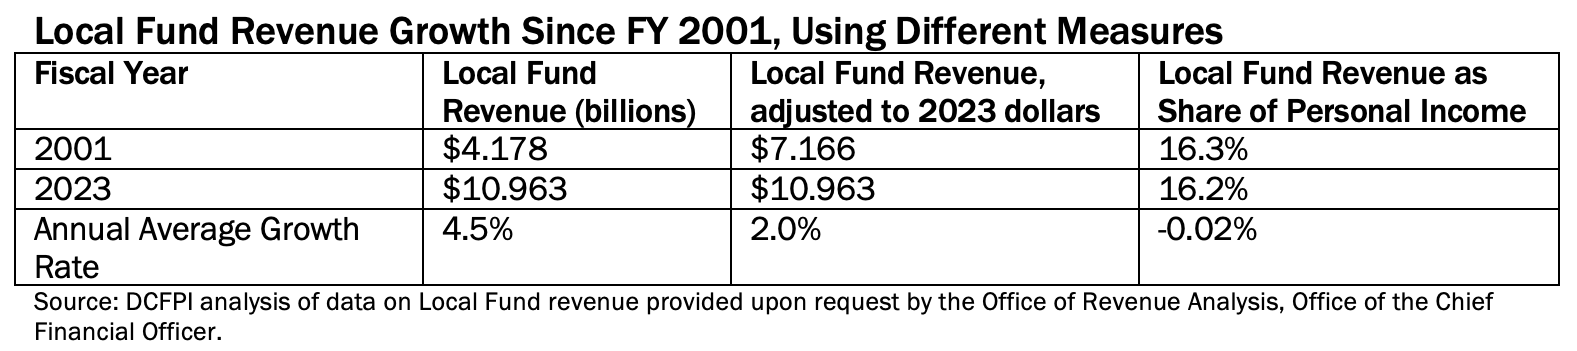
Adjusting for inflation with the consumer price index (CPI) can help correct for some of that exaggeration. For example, the annual average growth rate of Local Fund revenue over the past 22 years declines from 4.5 percent to 2 percent, once adjusting for inflation (Table 1).
But even accounting for inflation doesn’t offer a fully adequate adjustment of budget trends because the CPI is based on what consumers buy, which is different from what governments purchase (labor, equipment, office buildings, etc.). The CPI is also unable to account for growth in particular sectors of the population whose needs may be costlier than the average residents’, like seniors, or particular areas of spending that may require more intensive resourcing, like health care.[10] Moreover, spending needs to keep up with real growth in the economy beyond inflation and population in order for the District to be able to recruit and maintain public employees and contractors. The District will struggle to find teachers, first responders, and other employees willing to take on core service-providing jobs if spending on those services increases so slowly that it holds down wages.
Table 1
Looking at the average annual change in Local Fund revenue as a share of the economy shows a negative picture, with an average annual change of -0.02 percent, again emphasizing a general steadiness over time with a slight decline. Some who cite Gross Funds budget growth, in nominal terms, wrongly use it as evidence that District spending is out of control. But this claim fails to hold up once local revenue is anchored in DC’s broader economic context.
Certainly, the executive and the DC Council should exercise good governance and ensure that District spending is effective and efficient, as a matter of course. Lawmakers can look for redundancies and programs that are outdated, or with goals that are better served in a different way, to aim for the most impactful spending possible. They can require more rigorous evaluations of program success[11]—both those administered through the budget and through the tax code—and follow recommendations by the DC Auditor’s office for improving performance and effectiveness.[12] Stronger practices and better implementation of evaluative practices may help produce savings that the District can put to better use. Lawmakers can do this and continue to target a level of spending as a share of DC’s economy that keeps DC moving toward greater progress.
Recent meaningful investments have resulted in progress toward addressing deep and longstanding inequities—something that is squarely the role of DC government and yields benefits for all residents and the economy writ-large.
DC Makes Meaningful Investments to Address Inequity, but Broad Forces Hold Greater Progress at Bay
The District is home to a strong economy, deeply entrenched racial and economic disparity, and a commitment to progressive policy change. This means that DC is a leader on many policy fronts and has leveraged its resources to advance transformative solutions to big social problems. Many of these transformative advances have been adopted in the last decade or two. They’ve paid off in the short term, sometimes by preventing worse outcomes and, over the medium-term, by making headway toward meeting needs. They should also pay off over the longer term by dismantling inequities and setting up DC residents for a stronger future, if lawmakers maintain current commitments and build on them.
Undoing racial and economic inequities that were centuries in the making will take a sustained, long-term effort in the face of broad economic forces at play that actively slow our progress. Recent federal and local pandemic relief also underscores the gains that can be achieved with intentional policy choices to address racial and economic inequity. Poverty in DC declined in 2022 to 13.3 percent from 16.5 percent the year prior. Likewise, the poverty rate among Black people in DC decreased to 21.3 percent from 27.7 percent in 2021, a statistically significant decrease. This improvement likely reflects a combination of factors including the overall decline in unemployment, a growing minimum wage, and federal and local investments in response to the COVID-19 crisis.[13]
DC has made other meaningful public investments to solve big social and economic challenges, as outlined in some key examples below:
Investments in Early Childhood
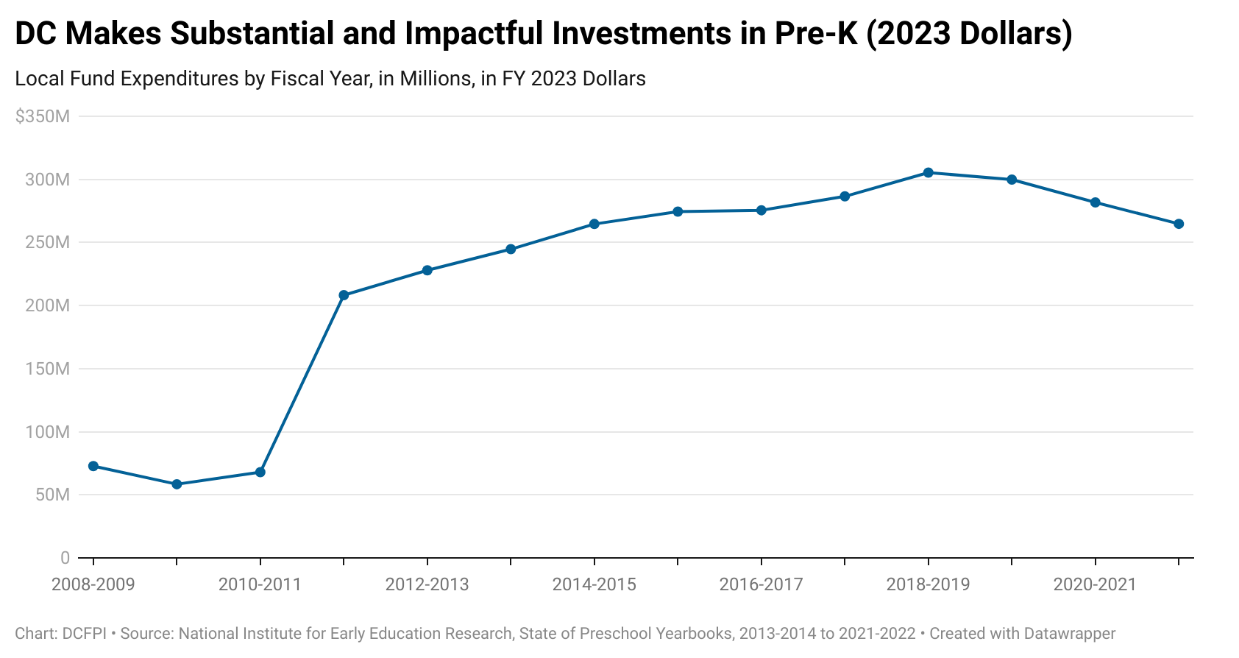
DC has been a leader in early childhood development. In 2008, DC Council passed legislation vastly expanding early education in the District, with the aim of extending Pre-K to all 3- and 4-year-olds in DC. The program represents a major public investment, and the expense has been worth the results. Spending on public Pre-K, when adjusted for inflation, has grown from about $72 million in its first year to $265 million in 2022 (in 2023 dollars) (Figure 5).
Figure 5
The growing investment has allowed for the share of young children participating to grow to 79 percent of 3-year-olds and 88 percent of 4-year-olds in 2023, up from 28 and 64 percent prior to expansion, respectively.[14] In addition to vastly increasing participation, evaluation of the program finds that DC Pre-K for 3-year-olds significantly improves their likelihood of staying in the public school system, reduces shifting of children from one school to another, and stabilizes children’s early lives—a positive outcome for children, families, and public education systems. This research also finds that these results are strongest in communities of color and communities with low incomes.[15] Another way to look at this is that Pre-K has increased the connection of families to the District.[16]
In addition, DC’s free, high-quality Pre-K program has been shown to have positive economic benefits for families that go beyond the cost savings. For example, it increased maternal labor force participation, according to a study by the Center for American Progress (CAP). CAP’s study finds that the increase in mothers’ labor force participation since adoption of universal Pre-K was almost entirely attributable to the expansion (10 out of 12 percentage points).[17] Because of the program, DC mothers with Pre-K aged children participate in the workforce at the same rate as mothers with elementary school-aged children. Pre-K also boosted work hours for mothers, making full-time work more likely among married women and part-time work more likely among unmarried women. CAP’s research also points to other likely positive economic externalities of higher maternal labor force participation, like faster growth in GDP, greater economic security for young families, and greater workforce tenure for women who end up making fewer career sacrifices to care for young children. All of this is good for DC’s children, families, businesses, and economy.
Expansion of Health Coverage
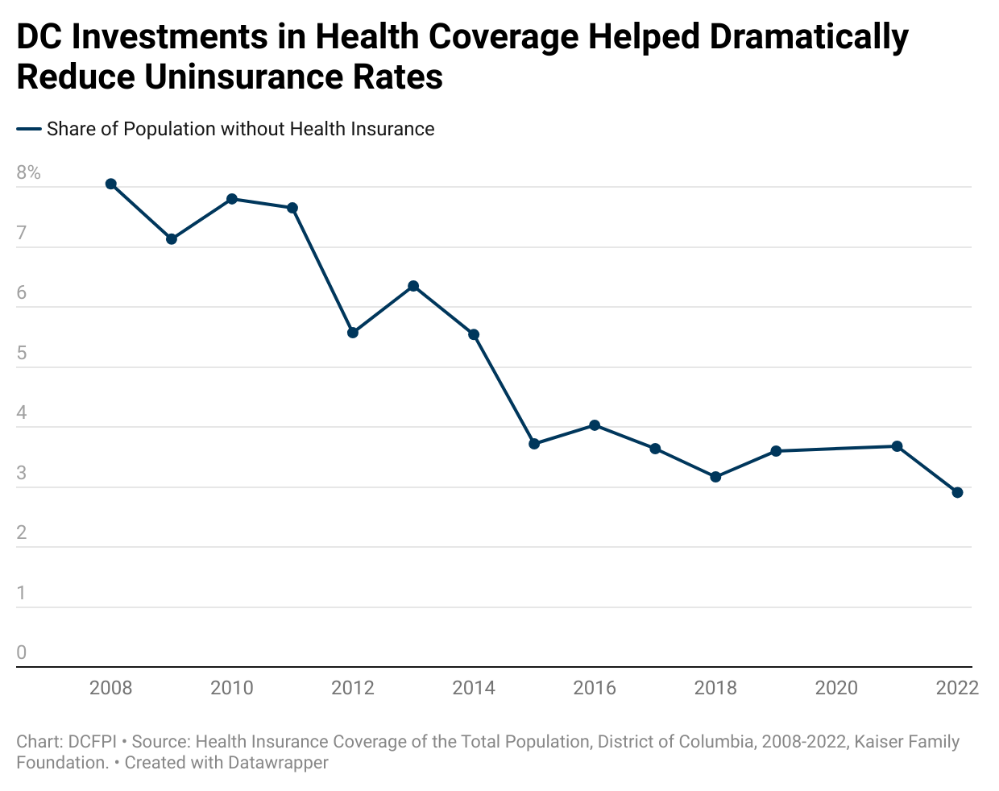
DC has also been a leader in ensuring health insurance coverage of its residents. DC made investments over the last two decades in adoption and expansion of the Health Care Alliance, which offers locally-funded coverage to those ineligible for Medicaid, administration of the District’s health care exchange, and Medicaid expansion. These efforts have contributed to DC covering nearly all residents. In 2022, just 2.9 percent of residents lacked health coverage compared with around 8 percent in 2008, prior to federal adoption of the Affordable Care Act (ACA) (Figure 6). A major drop in the uninsured happened in DC in 2015, the year after lawmakers implemented Medicaid expansion on January 1, 2014.[18]
Figure 6
Analysis of ACA Medicaid expansion in the states shows a wide range of positive effects that include better access to health care, improved health outcomes, medical debt reduction, better credit, lower eviction rates for renters with low incomes, and reduced uncompensated care costs.[19] Expanded health coverage under the ACA has also been shown to contribute to a healthier workforce and higher productivity, all of which is good for people, businesses, and DC’s economy.[20] It’s also been shown to support entrepreneurship. In fact, in the District, 30 percent of residents ages 21-64 who are covered by its ACA Marketplace are small business owners or self-employed persons.[21]
Building Affordable Housing
A growing population over the last couple of decades has been unsurprisingly matched with a growing demand for housing in the District. Creating new affordable homes, including income-restricted housing that is affordable to residents with the lowest incomes, is one critical strategy for making housing more affordable and preventing displacement. DC’s Housing Production Trust Fund (HPTF) has become a central tool to support this strategy, providing grants and loans to private and nonprofit housing developers to support the development of affordable rental and homeownership units.[22]
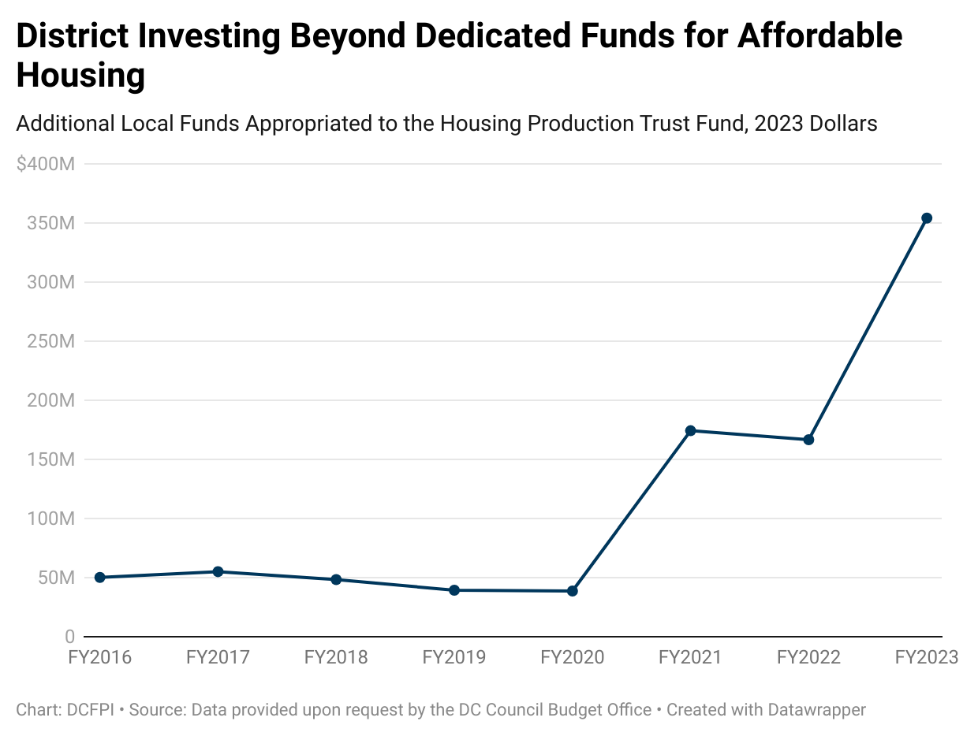
Though put into effect in 1988, the HPTF did not receive regular funding until FY 2002, when lawmakers dedicated 15 percent of Deed Recordation and Transfer taxes to the HPTF—an amount boosted in FY 2007 with the expansion of that tax.[23] In more recent years, DC has also driven local fund dollars to support the HPTF including with budget surpluses and American Rescue Plan Act local revenue replacement funds, all of which have allowed for unprecedented levels of investment in the HPTF (Figure 7).[24] Since 2019, this tool also has been a central piece of Mayor Bowser’s strategy to build 36,000 new housing units, including 12,000 affordable units by 2025.[25] To date, the HPTF has helped create 9,320 affordable units, most of them since 2019.[26] This is not nearly enough to meet full need for renters with extremely low incomes, which the National Low Income Housing Coalition estimates at 33,374 units.[27] Still, it is a critical tool without which the affordable housing crisis in DC would be that much more dire, and that can be expanded in the future to more adequately address need.
Figure 7
Getting Cash to Families with Low Incomes
The expansion of DC’s EITC, which boosts the incomes of those earning low and moderate pay, is another powerful policy tool funded through DC’s Local Fund budget that reduces hardship and expands economic opportunity. The DC credit is a match to the federal credit and has gone from 10 percent of the federal in the year 2000 to 40 percent by 2008 and will rise to 100 percent by 2026. Prior to the most recent expansions that are currently underway, the Office of Revenue Analysis estimated that DC’s EITC reduced poverty by 11.5 percent.[28] The credit aids DC’s progress in addressing hardship while also boosting what residents have to spend in their communities and at local businesses. It also can have a big benefit on the future of disadvantaged children, as expansive research shows the income boost helps them do better and go further in school and work and earn more as adults.[29]
Ending DC’s Deep, Longstanding Inequity Will Require Much More Effort
While DC has been a leader in progressive policy change, including the areas detailed above, substantial additional public investment and intentional policy change is needed to cut through its deep, longstanding racial inequities. Generations of policies and practices created racially disparate outcomes in housing and wealth, employment and income, education, and health.
For example, DC’s Black Codes, laws originating in 1808 that among other things severely limited Black employment opportunities, and other pervasive labor market discrimination of the past, combined to firmly establish a greater likelihood of poverty and hardship and kept Black residents and other non-Black residents of color from living to their fullest.[30] Government-sanctioned practices, such as racist zoning policies, residential segregation, redlining, restrictive covenants, eminent domain, and others, widened the racial wealth gap created at the outset by African enslavement. These intentional efforts to oppress Black people have left Black and brown residents of the District less likely to own a home and more likely to rent in a market with extreme and rising costs, with fewer resources to keep from falling behind on rent and facing eviction.[31]
Racism, of course, is not a thing of the past and continues to shape systems, policies, and practices. Black people continue to face discrimination in the labor market, including when it comes to hiring, salary, and job loss during economic downturns, as is documented by research.[32] Despite a low overall unemployment rate in the District today, the Black unemployment rate is one of the highest in the nation while the white unemployment rate is one of the lowest. This disparity in unemployment is chronic. Going back to the year 2000, Black unemployment has never dipped below about 8 percent, and it has been as high as 19 percent. Meanwhile, white unemployment has never been higher than about 4 percent and hit as low as 1.4 percent just following the pandemic.[33]
Similarly, despite progress in 2022, the District’s stark racial disparities in poverty are also chronic. Over a ten-year period (2012 to 2022), the Black poverty rate never dipped below 21.3 percent and was as high as 28.7 percent. In other words, at least 1 in 5 and sometimes more than 1 in 4 Black residents has lived in poverty in any given year over the last decade, underscoring persistent economic hardship and disadvantage. That stands in stark contrast to the experience of white residents, whose poverty rate over that timeframe never reached 8 percent (or about 1 in 13) and was as low as 5 percent (or 1 in 20).[34]
Income inequality in DC is high, by many measures. The Gini Index, which measures the distribution of income across households in an economy, ranks DC high relative to other states and territories. Where 0 equals total equality and 1 equals total inequality, DC is one of three jurisdictions with a score over 0.5, alongside New York state and Puerto Rico. DC’s Gini Index score in 2022 also falls around the middle of the pack compared with the nation’s ten largest cities, despite its small size. It is less unequal than Dallas, Houston, Los Angeles, and New York, for example, but on par with Chicago and Philadelphia and worse than Austin, Phoenix, San Antonio, and San Diego.[35]
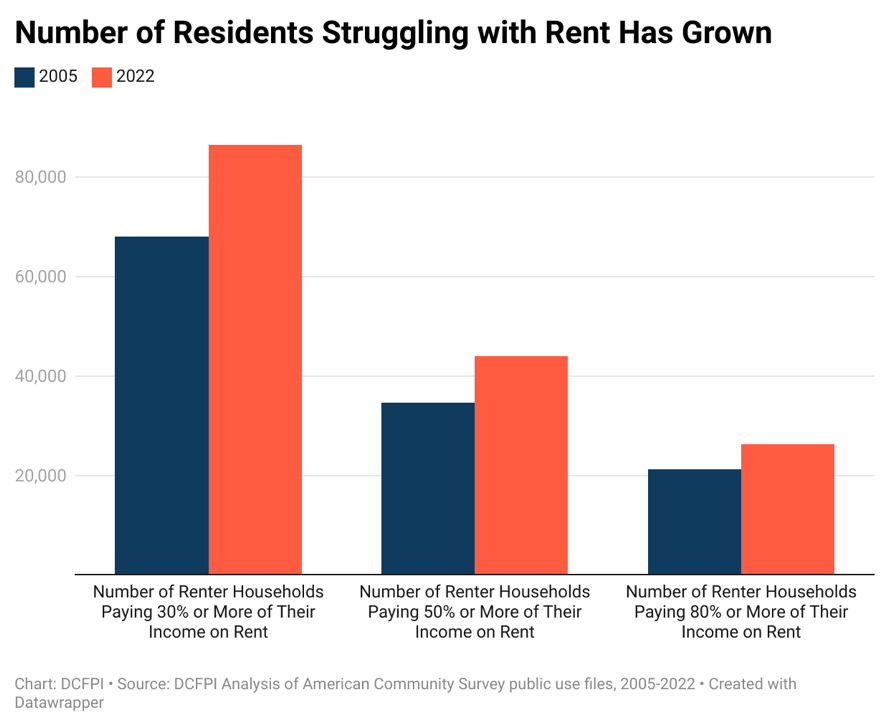
Gentrification and displacement, which may very well be seen as outgrowths of inequality, have become rampant in the District. Between 2000 and 2020, the Black population declined by nearly 58,000 while the white population grew by almost 86,000, an analysis of census data shows. In 2000, 32 of DC’s 62 residential neighborhoods were majority Black, but by 2020, only 22 residential areas remained majority Black.[36] Efforts to vastly ramp up investments in affordable housing production over the last several years have undoubtedly moderated these forces but remain inadequate to counter them in full. Between 2005 (the earliest year for which we have comparable data) and 2022, the number of households spending more than 30, 50, and 80 percent of their incomes on rent increased (Figure 8).[37] For example, the number of renter households paying 50 percent or more of their income in rent in 2022 rose to 44,000 (or 27 percent) from nearly 35,000 in 2005 (or 25 percent) and about 39,000 in 2012 (or 26 percent).[38] Not surprisingly, median contract rent in DC, as reported by the US Census Bureau, grew by nearly 20 percent since 2012.[39]
Figure 8
Inequities by race, ethnicity, gender, immigration status, and intersecting identities undermine people, families, communities, and DC’s economic potential on the whole. A substantial body of research finds that inequality hampers economic mobility and growth in the long run.[40][41] Inequality suppresses income growth for middle- and low-income households, according to several US based studies, and conversely suggest that redistributing resources in ways that reduce inequality can strengthen economies.[42]
In sum, while tackling inequality in the District is a tremendous undertaking that will take generations to fully achieve, the pay-offs are wide-ranging and far-reaching.
Government Investments Can Reduce Inequality and Strengthen Communities and the Economy
Public investments are foundational to a strong economy. Whether it’s building infrastructure, developing human capital, or providing the kinds of amenities that attract private investment, government spending matters for the economy.[43] Public investments also undergird residents’ quality of life. In DC, many communities enjoy green spaces and parks, splash pads and public pools, bike lanes and bikeshare, soccer fields and basketball courts, expansive public transit, robust public libraries, and much, much more.
DC’s public investments also take aim at inequality. Reducing inequality can strengthen the economy, particularly through reduction of poverty and strengthening of the middle class. Nationally, if inequality by race, ethnicity, and gender were eliminated, one analysis found the US economy would experience dramatic, positive shifts.[44] This research models income, poverty, and economic changes that would result from truly equal opportunity,[45] nationally, and finds that:
Black, Latinx, and Asian workers would earn nearly 61 percent more, on average, with women of color earning 88 percent more. Total income in the United States would increase by about one-third, or $4.3 trillion.
GDP would be 33.5 percent higher and tax revenue to invest in thriving communities would jump by about $1.2 trillion at the federal level and $636 billion at the state and local level.
The national poverty rate would drop by nearly 40 percent, overall, and the rates for Black and Latinx people by about half.
Reducing inequality would also strengthen DC’s economy and tax base. Unpublished analysis by Dr. Robert Lynch and the Center on Budget and Policy Priorities using the same model with more limited data for DC, in 2020 dollars, finds that equal opportunity among the Black, Latinx, and white populations would result in:
Average incomes for Black workers rising by 160 percent, from about $45,000 to about $116,000. And in fact, because income tends to rise with age and DC’s Black population skews older than its white population, average income for Black households would outpace that of white households by about $6,000.
Average incomes for Latinx workers going up by 90 percent, from about $56,000 to about $107,000.
Average income gains for Black and Latinx workers combined resulting in about $21.1 billion more in aggregate income that would boost income tax revenue for the District to further invest in communities and shared prosperity.
While this model reflects a hypothetical scenario, a substantial body of research has deepened collective understanding of the harmful effects of inequality for economic growth, innovation, and the distribution of power and resources.[46] Expansion of District revenues used for the purpose of addressing hardship and lack of opportunity would help DC address the extreme level of inequity rooted in a racist history that keeps residents from fully contributing to the economy and stifles innovation.
For example, one study looking at disparities in innovation—an important economic driver—by race, gender, and income, finds that if children in the bottom 80 percent of the income distribution in DC were to grow up to invent at the same rate as children from the top 20 percent, the District would have five times as many children growing up to be inventors.[47] Another study found that even in the short-run, economic supports can help people with entrepreneurial ideas take risks and pursue those ideas.[48] Moreover, because most jobs created in a state are homegrown, public investment in services that meet needs, repair harms, and expand opportunity, can help both residents and businesses achieve their full potential.[49]
International Comparisons Underscore that Greater Spending (and Taxation) Can Address Poverty and Inequality
Robust delivery of resources in ways that lower net inequality has been shown in international research to aid faster and more lasting economic growth, in part through ability of people to live healthier, more productive lives.[50] Yet, the US taxes and spends much less as a share of GDP compared to most other rich countries, which limits its ability to push against poverty and inequality. For example, US spending is 37.8 percent of the economy, compared with 55.6 percent for France, 53.3 percent for Finland, and 41 percent for the UK. As a result, the US does much less to reduce poverty than most any other rich nation. Taxes and transfers—tax or safety net programs that deliver resources to those in need—reduce 83 percent of poverty in Finland, 77.6 percent in France, 62.4 percent in the UK, compared with just 33.1 percent in the US.[51] These international comparisons underscore that robust public investment can mitigate inequality and improve quality of life broadly.
By Growing Revenue and Spending, DC Can Pursue More Transformative Change
Past experience demonstrates that in addition to providing the foundation for a robust economy and quality public amenities, the District’s public investments can meaningfully address big social and economic challenges. However, the extreme level of racial and economic inequity and broader economic forces in DC require that lawmakers do more. DC can be a place where all residents have the opportunity to thrive and live to their fullest, but it won’t happen by chance. It will require intentional policy and practice to chart a course to a new future.
If DC were to commit to raising enough resources to maintain the peak level of revenue in FY 2022 as a share of the economy (about 16.6 percent), it would have $2.9 billion more than it is projected to have by FY 2028 (or $1.3 billion more than the 20-year average level of revenue as a share of the economy) to fund public services broadly and address inequity. Some of the needed growth in revenue could happen without tax changes, for example if macro-economic factors (such as interest rates) improve or if revenue projections prove overly pessimistic. These collective resources could help us make larger strides toward addressing some of the District’s biggest issues. Here are just a few examples of major progress to be had with more revenue:
Ending chronic homelessness: Ending chronic homelessness—or reaching “functional zero,” when DC has the resources and ability to house all those experiencing homelessness in any given month—would be a key step in repairing one of the deepest harms of centuries of structural racism and discrimination. DC committed to doing so in Homeward DC 2.0, its FYs 2021-2025 Strategic Plan to End Homelessness, and the single most important step the District laid out in that plan is to expand the Permanent Supportive Housing (PSH) program. PSH combines rental assistance with supportive services for an unrestricted period, with most participants exiting the program when they pass away. While District leaders have made major recent investments in PSH, leaders and providers must do more to put DC on the path to ending chronic homelessness and address implementation challenges that threaten progress. DCFPI analysis shows that DC could essentially end chronic homelessness in six years with $770 million in cumulative spending over that time frame.[52]
Ending child poverty: DC can take aim at child poverty and change the life trajectories of tens of thousands of children, most of them Black, with a robust local Child Tax Credit (CTC). More than 1 in 5 children in DC live in poverty and, because of systemic racism, more than 1 in 3 Black children live in poverty. Poverty, especially when it’s persistent, has long-lasting negative effects on children and their well-being into adulthood. During the pandemic, the expanded federal CTC, which has now expired, cut child poverty in DC by half. DCFPI proposes a credit of $1,500 per child, which is estimated to reduce child poverty by 18 percent, relative to the supplemental poverty measure, setting thousands of children up for a stronger future. DCFPI’s proposal would cost $115 million per year.[53]
Ending displacement: DC can take a holistic approach to ending displacement of residents who have low incomes by ramping up its investments in affordable housing production and preservation, while also increasing its commitments to direct supports like rental assistance and housing vouchers. In testimony to the DC Tax Revision Commission, a panel of nonprofit affordable housing developers noted that an annual HPTF commitment of closer to $311 million to $340 million alongside a corresponding expansion of operating subsidies to ensure housing for residents with the very lowest incomes would much better support production at the scale needed.[54] In 2006, a Comprehensive Housing Strategy Task Force called for an ambitious array of policy solutions to the growing housing affordability crisis, including direct annual support to nearly 15,000 households annually through a variety of voucher and public housing investments.[55] This included 1,000 locally funded vouchers for tenants per year over 15 years—a goal the District has never come close to achieving. DC should again set high ambitions and redouble efforts by fortifying DC’s emergency rental assistance program, ramping up locally funded housing vouchers, and exploring other ways to support households that find themselves unable to afford housing year after year, like strengthening and expanding rent control and providing small amounts of rental assistance known as “shallow subsidies.”[56] Funding tenant-based vouchers for just one-quarter of the housing assistance waitlist could cost $276 million for the vouchers alone.[57]
Building Black wealth: DC’s Black Homeownership Strikeforce, an appointed group of government and public experts on housing and racial equity, identified the Home Purchase Assistance Program (HPAP) as the District’s main tool for tackling the racial homeownership gap. In FY 2022, 74 percent of HPAP borrowers were Black and 61 percent identified as female. DC recently more than doubled the maximum loan amount but without additional funding for the program, leaving it with insufficient funding to meet demand. DC should at least double to $50 million per year funding for the program while also evaluating whether the variations in loan amount by income and family size are adequate relative to the high costs of homes in the District. In addition, DC can expand its property tax credit (known as Schedule H) to better support longtime homeowners with low and moderate incomes to stay in their homes in the face of rising property values and taxes so that they can keep that wealth in their family. Depending on the size of the expansion, this could cost between $20 to $30 million per year.
Ensuring affordable child care for all families: DC has taken critical first steps toward ensuring equity at birth, as envisioned in the District’s “Birth-to-Three for All DC Act” (Birth-to-Three), by raising the pay of early educators in the child care sector to align with those of public Pre-K teachers. DC must invest further to ensure equitable pay and high quality, affordable care for the District’s children and parents. For example, the Pay Equity Fund (PEF) that raises teacher pay would need $33.6 million in FY 2025 to implement the full salary scale that rewards educators’ experience as intended by the PEF and Birth-to-Three.[58] In addition, to fully achieve the Birth-to-Three vision that no family spend more than 7 percent of its income on child care, DC will need to expand its funding for child care subsidies to over $200 million.[59]
These are but a few of the public investments DC should pursue to make more meaningful progress at dismantling longstanding inequities and setting up residents, businesses, and communities across all of DC to thrive. Letting revenue fall relative to economic growth at this time will only cause DC to lose ground on its achievements thus far to create a thriving, racially and economically equitable District.
Appendix I: What’s In the Gross Funds Budget?
The Gross Funds budget is made up of the Local Fund (major taxes and fees), Federal Grants and Medicaid contributions, Federal Payments and Special Purpose Revenue, and Dedicated Taxes. The Office of the Chief Financial Officer defines the non-Local Funds that do not flow from the federal government as follows:[60]
“Dedicated taxes are broad-based taxes (or portions thereof) that are dedicated by law to certain purposes, such as sales tax revenue that supports the convention center. In recent years, several special-purpose revenue funds were reclassified as dedicated taxes because they draw from broad-based revenue streams and fund programs in multiple agencies.”
“Enterprise funds are budget and accounting units created for particular agencies, such as the Water and Sewer Authority, which are intended to operate like businesses and to be entirely self-sustaining.”
“Special Purpose Revenues are program revenues that are generated from fees, fines, special assessments, charges for services, and reimbursements that are set aside for a specific purpose for the District agency that collects the revenues to cover the cost of performing the related function.”
In all three cases, the purpose of the revenue is pre-set and not typically debated or modified in year-to-year budget debates.
Appendix II: Measures of the Economy Used by the Bureau of Economic Analysis[61]
State Personal Income (PI)
“Income that is received by, or on behalf of, persons who live in the state. It is calculated as the sum of wage and salary disbursements, supplements to wages and salaries, proprietors’ income with inventory valuation adjustment (IVA) and private capital consumption adjustment (CCAdj), rental income of persons with CCAdj, personal dividend income, personal interest income, and personal current transfer receipts, less contributions for government social insurance. Estimates of state personal income are presented by the place of residence of the income recipients. All estimates of state personal income are in current dollars (not adjusted for inflation).”
Gross domestic product (GDP)
“Gross domestic product (GDP) measures the value of final goods and services produced within the United States. Also known as value added, GDP is the value of goods and services produced by private industry and government, less the value of goods and services used up in production. GDP is also equal to the sum of personal consumption expenditures, gross private domestic investment, net exports of goods and services, and government consumption expenditures and gross investment. GDP by state is the state counterpart to the Nation’s gross domestic product (GDP).”
[1] The Mayor’s proposed FY 2025 budget would freeze the DC EITC at 70 percent of the federal credit, rather than allowing it to increase to 100 percent of the federal credit. The proposal is not law, and the DC Council still has time to rejected that proposal.
[2] For a breakdown of the differences between state and local spending, see: Urban Institute, “State and Local Expenditures,” State and Local Backgrounders, February 2023.
[4] DC is prohibited by federal law to tax the incomes of non-residents, which means that many DC workers and many DC businesses that pass their profits through to owners do not pay into DC’s income tax system.
[5] At the time of data retrieval from the Bureau of Economic Analysis, available quarterly personal income data for DC went back to 2000 and available quarterly GDP data for DC went back to 2006. Quarterly data were used to create fiscal year estimates for the purpose of this analysis. For example, FY 2001 is made up of quarter 4 in calendar year 2000 and quarters 1-3 in calendar year 2001.
[6] It’s important to note that Local Fund revenue and spending as a share of the economy in FY 2021 – FY 2023 does include federal funding delivered to states and DC via the American Rescue Plan Act as Local Revenue Replacement to shore up normal, recurring spending and stave off budget cuts. These funds were used differently than other forms of federal aid during the same timeframe.
[8] DCFPI analysis of OCFO provided data on Local Fund revenue from 2000 to 2023, BEA quarterly personal income data, and OCFO’s February 2024 revenue report’s projections.
[9] Nominal spending refers to the dollar amount in that year of the budget, rather than “real” (or inflation-adjusted) dollars that better convey the purchasing power of a dollar relative to some basket of goods or spending as a share of the economy, which for reasons explained in-text is the best reflection of fiscal capacity.
[10] Some analysts divide taxes and spending by population size to determine a per capita level of fiscal capacity or effort. However, this measure falls short for many of the same reasons noted for comparisons of nominal or even inflation-adjusted revenue and spending figures. Per capita analyses fail to account for growth in the costs of providing services, the fact that some populations or types of spending may require more effort, or the broader context of what’s affordable based on the performance of the economy.
[14] Friedman-Krauss, A. H., Barnett, W. S., Hodges, K. S., Garver, K. A., Jost, T. M., Weisenfeld, G., Duer J. (2024). “State Profiles: District of Columbia.” State of Preschool: 2023 Yearbook. New Brunswick, NJ: National Institute for Early Education Research.
[18] See “Health Insurance Coverage of the Total Population,” State Health Facts, Kaiser Family Foundation. Massachusetts is the only state with a lower rate of uninsured than the District. The number of uninsured dropped from 45,000 in 2008, to 34,500 in 2014, to 23,600 in 2015, and down to 18,600 in 2022.
[35] DCFPI analysis of 2022 American Community Survey data, Table B19083: Gini Index of Income Inequality by major city. Differences cited here are statistically significant.
[37] The share of renter households with these rental burdens decreased slightly across all three categories due to the increase in the overall number of renter households.
[38] DCFPI analysis of ACS 1-year data files. ACS data prior to 2005 were not methodologically comparable.
[39] Effective monthly rent—average rent paid minus any move-in incentives as reported by ORA via CoStar—was steady most of the last 10 years, with a slight decline since the pandemic privately-owned buildings with at least 5 units and don’t reflect all rental housing in DC.
[45] Equality of opportunity in this analysis is defined as when all racial, ethnic, gender groups earn the same average total money income as white, non-Latinx males, adjusted by age distribution. This results in an increase in hypothetical earnings for women and people of color that reduces poverty and increases tax revenue and GDP. Lynch notes that policies to create equal opportunity would benefit white males, as well, but these benefits were not assessed and included in his study.
[48] Gareth Olds. June 2016. “Food Stamp Entrepreneurs.” Harvard Business School Working Paper No. 16-143. This study finds that one of the things that holds back entrepreneurship is the risk of leaving wage employment to pursue ideas, and having income supports (or economic supports that mimic income like food stamps) help lessen that risk.